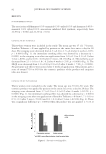
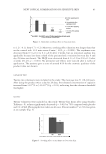
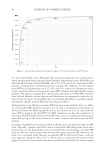
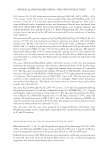
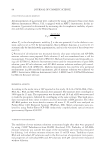
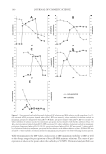
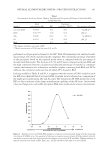
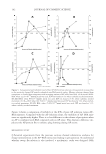
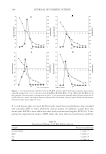
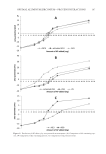
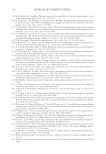
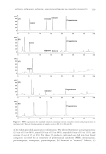
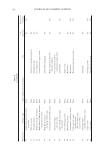
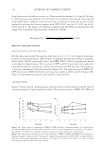
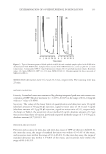
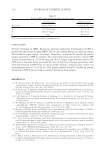
OPTIMAL ALUMINUM/ZIRCONIUM—PROTEIN INTERACTIONS 107 Figure 8. Prediction of AP effi cacy by zeta potential measurements. (A) Comparison of Al containing spe- cies, (B) comparison of Zr containing species, (C) comparison of Al polyoxocations.

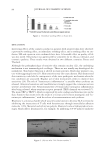
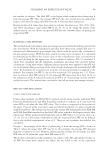
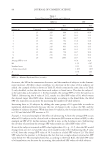
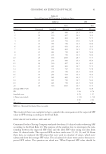
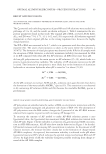
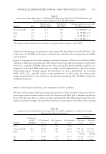
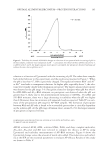
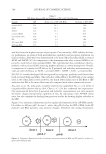
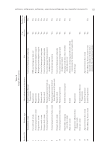
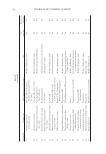
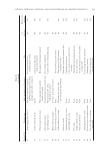
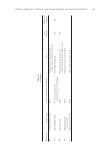
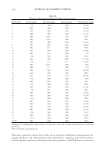
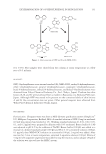
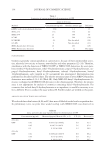
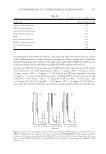
JOURNAL OF COSMETIC SCIENCE 108 and also forms the highest amount of precipitate. Concomitantly, ACH exhibits the low- est performance in terms of both neutralization capability and precipitate formation. In clinical studies, ZAG has been demonstrated to be more effi cacious than ACH, activated ACH, and ASCH (36). In comparison to the aluminum-only salts, activated ZAG is ex- pected to work better than standard ZAG. The experimental data corroborates this hy- pothesis, with activated ZAG achieving higher turbidity at a lower dosing level. Overall, a comparison of commercial AP effi cacy by ζ-potential and turbidity measurements pro- vides an order of effi cacy as: ACH activated ACH ASCH ZAG activated ZAG. ZG (CP-2), a newly developed AP salt reported by our group, performs much better than both activated ZAG and ZAG. The turbidity of ZG–BSA at the IEP falls at the similar level as two other ZAG actives however, the much lower molar ratio of ZG/BSA at IEP indicates that ZG is the most effi cacious salt compared with other commercial actives. Al30-mer, as an 18+ polycation, would be expected to outperform Al13 (7+) in terms of coagulation/fl occulation effi cacy (40). Chen et al. (3,6) has confi rmed this expectation. Our experimental data from ζ-potential and turbidity measurements not only supports the better charge neutralization capability of Al30 by indicating a low AP/BSA molar ratio, but also confi rms the fi nding from previous studies by showing higher turbidity at the IEP. Figure 9 is a schematic illustration used to explain the formation of the AP–BSA insolu- ble adduct at different pH. In zone 1, where the pH is below the IEP of BSA, both AP particles and BSA particles carry positive charges. Therefore, the strong electrostatic Table V IEP, Molar Ratio at IEP and Turbidity at IEP of AP–BSA Mixtures Samples IEP Molar ratio at IEP (AP–BSA) Turbidity at IEP (NTU) activate ACH 5.61 24:1 549 ACH 5.28 30:1 360 ASCH 5.25 22:1 663 activated ZAG 5.28 7:1 416 inactivated ZAG 5.65 8:1 390 ZG 5.08 3:2 386 Al13-mer-BSA 5.58 4:1 520 Al30-mr-BSA 5.33 3:2 812 Figure 9. Schematic illustration of the electrostatic interaction between BSA and AP particles in three re- gions under different pH.
Purchased for the exclusive use of nofirst nolast (unknown)
From: SCC Media Library & Resource Center (library.scconline.org)