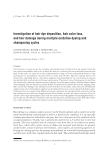
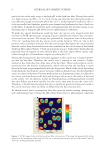
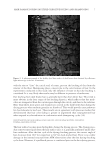
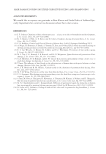
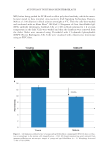
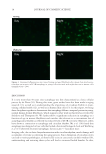
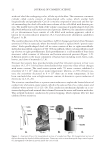
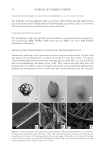
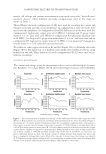
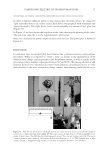
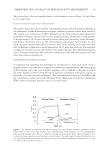
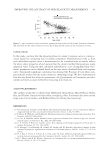
AUTOPHAGY IN HUMAN SKIN FIBROBLASTS 15 MO) before being probed for LC3B with a rabbit polyclonal antibody, which the manu- facturer stated to have minimal cross-reactivity (Cell Signaling Technology, Danvers, MA) at a 1:100 dilution in block solution overnight at 4°C. Then the cells were washed and incubated with an Alexa Fluor® 488 F(ab’) 2 Fragment of Goat Anti-Rabbit IgG (H+L) antibody (Invitrogen, Carlsbad, CA) at 1:400 in block solution for 1 h at room temperature in the dark. Cells were washed and then the chambers were removed from the slides. Slides were mounted using Vectashield with 4’,6-diamido-2-phenylindole (DAPI) (Vector, Burlingame, CA). Cells were visualized with a fl uorescence microscope using an FITC fi lter. Figure 1. (A) Immunocytofl uorescence of young and aged fi broblasts comparing LC3B levels show a reduc- tion in autophagy in the mature cells (magnifi cation = 20×). (B) Graph summarizing pixel intensity from immunocytofl uorescent microscopic images of young and aged fi broblasts (n = 4). Autophagy decreased 23.8% (±1.9% SEM).

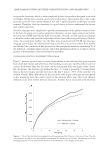
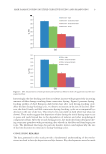
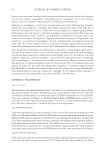
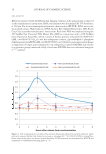
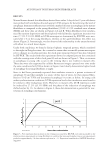
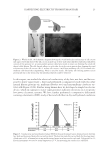
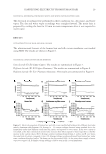
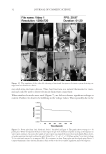
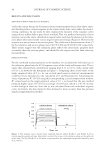
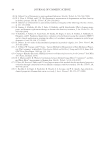
JOURNAL OF COSMETIC SCIENCE 16 RNA ANALYSIS RNA was extracted with the RNeasy Kit (Qiagen, Valencia, CA) and prepared as directed in the manufacturer’s instructions. RNA concentration was determined by UV absorbance at 260 nm. For reverse transcription-polymerase chain reaction (RT-PCR), RNA was reverse transcribed using a High-Capacity cDNA Archive Kit (Applied Biosystems, ABI, Foster City, CA), as per the manufacturer’s instructions. Real-time PCR was employed using the 2X TaqMan Fast Universal PCR Master Mix (ABI) in conjunction with a 20X TaqMan Gene Expression Assay Mix, which consists of human primers and probes for MAP1LC3 (ABI, cat# Hs00797944_s1) and the endogenous control, glyceraldehyde-3-phosphate dehydrogenase (GAPDH) (ABI cat# Hs99999905_m1). Relative gene expression [change in expression of target gene normalized to an endogenous control (GAPDH) and relative to a reference group (untreated cells)] of real-time RT-PCR data was calculated using the 2-ΔΔCT method. Figure 2. Cell synchronization was induced by nutrient deprivation followed by nutrient repletion, which induced a temporal rhythm that showed an increase in autophagy by 77.9% (±10.9% SEM) in young fi bro- blasts, whereas this effect was absent in aged fi broblasts. LC3B expression was determined by RT-PCR and normalized to GAPDH housekeeping genes (n = 3).
Purchased for the exclusive use of nofirst nolast (unknown)
From: SCC Media Library & Resource Center (library.scconline.org)