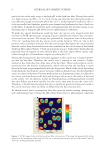
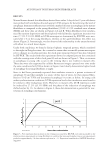
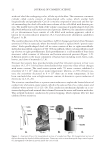
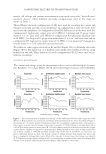
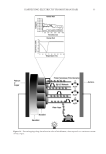
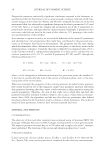
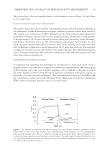
IMPROVING THE ACCURACY OF SKIN ELASTICITY MEASUREMENT 39 The pieces had a fl at and smooth surface with hardness scores of Shore 5A and Shore 0–10, respectively. IN VIVO HUMAN SKIN ELASTICITY MEASUREMENT The strain versus time curves of mode 1 measurement were collected from the database of our laboratory, in which numerous previously conducted clinical studies were archived. The studies were carried out in West Michigan of the United States and followed the guidelines of human clinical study on skin property testing. Volunteers of both genders in the age range of 18–82 years old and of various ethnicities (Caucasian, Asian, Hispanic, and African American) living in the United States participated those studies. In each study, the participants were asked to remove their facial makeup and cleanse the skin sites. Following acclimation to room temperature for 15 min, skin elasticity was measured in triplicate on each test site (the cheek or the inner forearm). The individual response curves of strain versus time were saved for calculation of the infl ection points (tIPs) and other skin elasticity parameters. DETERMINATION OF INFLECTION POINT A computational algorithm was developed to calculate the tIP from each of the mode 1 response curves. Since the elastic property of a material is represented by the linear region of the response curve, the tIP in a mode 1 response curve is defi ned as the point at which the curve begins to deviate from the linear region to a nonlinear viscoelastic region, as shown by tIP on the time scale in Figure 1. The algorithm was written in Visual Basic and the calculations carried out using Microsoft Excel (Microsoft Corporation, Redmond, WA) to process multiple response curves in a batch mode. Figure 1. An illustration to identify the infl ection point (tIP) and to defi ne viscoelastic parameters from a typical mode 1 strain versus time response curve of human skin. In the diagram, e(t) is the mathematical function of the response curve. The tIP is defi ned as the time in the relaxation phase when e(t) begins to devi- ate from the linear regression line of the elastic recovery region. The right-angled trapezoid bordered by e(ta), e(tIP), and the regression line is hence the elastic recovery area, and the remaining area bordered by e(tIP) and e(t) is that of the viscoelastic recovery.

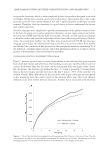
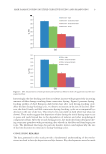
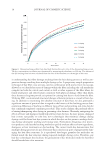
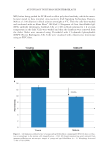
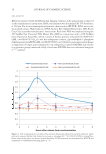
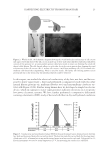
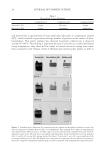
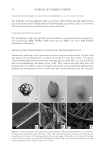
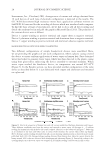
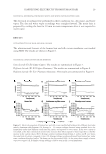
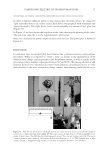
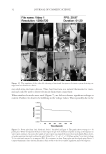
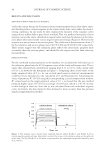
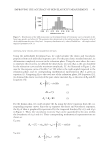
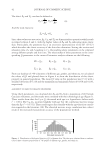
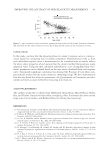
JOURNAL OF COSMETIC SCIENCE 40 RESULTS AND DISCUSSION RESPONSE CURVE OF PURE ELASTIC MATERIAL Under the current theory, the Cutometer elasticity measurement for an ideal elastic mate- rial should produce a linear response in the strain versus time curve under the mode 1 testing conditions. In our study, we fi rst examined the linearity of the response curves using silicone rubber slabs as pure elastic standard. That test produced near perfect linear response curves (the elastic deformation region before reaching the plateau) in the relax- ation phase when tested under various negative pressure settings (Figure 2). However, the response was not as linear in the suction phase. The coeffi cient of determination values (r2) for the relaxation and suction phases were 0.991 ± 0.006 and 0.956 ± 0.029, respectively. These results suggest that the relaxation phase refl ects the ideal elastic property more accurately than the suction phase, and should be the region used for skin elasticity measurements. INFLECTION POINT For the combined study populations in the database, we calculated the individual tIPs in the relaxation phase from the 4234 response curves of the cheek and forearm sites. The tIP values thus obtained had a distribution ranging from 0.11 to 0.19 s, with a mean value of 0.14 s, as shown by the histogram in Figure 3. Comparing these actual values to the single empirical value of 0.1 s, we can see how much error in elasticity measurements could have been introduced to the calculation of U and R parameters. Calculating the values of parameter R7 (Ur/Uf) using their corresponding tIPs and compare them with the R7 values based on the single empirical value of 0.1 s, we found that the new method produced higher values of Ur/Uf by an average of 0.184 unit, which is a 46.3% increase in skin biological elasticity. Since the tIP was calculated from each individual response curve, we believe the skin elasticity thus obtained is more accurate than the previous empirical approximation method. Figure 2. The response curves of pure elastic standards (silicone rubber, Ecofl ex 5, and Ecofl ex 0–10) at various negative pressure settings. Ideal elastic recovery (ER) is seen in the relaxation phase on the right side of the chart. The ER of Ecofl ex 5 at 500 mbar is represented by the right-angled trapezoid bordered by lines of e(ta) and e(t).
Purchased for the exclusive use of nofirst nolast (unknown)
From: SCC Media Library & Resource Center (library.scconline.org)