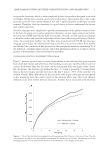
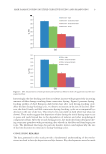
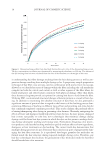
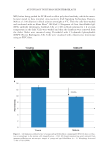
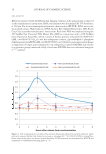
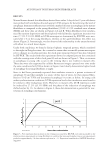
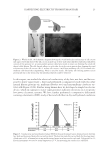
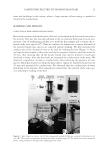
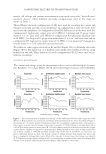
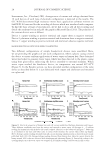
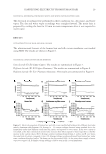
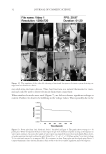
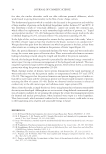
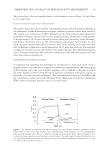
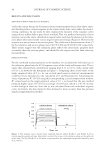
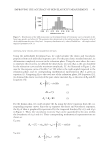
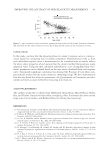
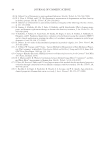
JOURNAL OF COSMETIC SCIENCE 42 The skin’s ER and VR can then be defi ned as: , 0 R R RV RE E V R R0 = = (6) And the total elasticity: R R TR E V = + (7) Since these values are area ratios, ER, VR, and TR are dimensionless quantities which result in values between 0 and 1, with the higher values of ER and TR indicating more elastic skin. Particularly, the parameter ER is an area-ratio representation of the R7 (Ur/Uf ) which describes the elastic recovery of the skin after distortion. Setting the suction and relaxation time of a and b equaling to 2 s, the resulting elastic parameters can be compared among different people and skin sites. The relationship of those parameters to the corre- sponding Q-parameters in the current Cutometer analysis software are the following: R0 = Q0, RE = QE, RV = QR, TR = Q1, ER = Q2, VR = Q3. From our database of 746 volunteers of different age, gender, and ethnicity, we calculated the values of Q2 and plotted them in Figure 4 to show the distribution of this elastic property in general population. The mean Q2 value in this population was 0.511 with a standard deviation of 0.146 and the maximum and minimum values of 0.858 and 0.186, respectively. AGE EFFECT ON SKIN VISCOELASTIC PROPERTIES Using the Q-parameters, we calculated skin ER and VR from a population of 463 female Caucasian volunteers, and the results were correlated with their chronological age (Figure 5). These results show that the ER or Q2 decreased with age in a logarithmic fashion with r2 = 0.664. The VR, Q3, increased slightly with age but the correlation was less strong than the ER (r2 = 0.5352). These results agree directionally with the age-elasticity correla- tion reported in the literature (18). The observed increase in age correlation was a direct result of the increased measurement accuracy of the Q-parameter method. Figure 4. Distribution of biological elasticity (Q2) of human skin. The data were obtained from a combina- tion of three volunteer populations of 746 people of different age, gender, and ethnicity.

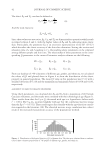
IMPROVING THE ACCURACY OF SKIN ELASTICITY MEASUREMENT 43 CONCLUSION In this study, we show that the relaxation phase of a mode 1 response curve is a more ac- curate region for calculating skin viscoelastic properties. Determination of the tIP from each individual response curve is demonstrated to be a method more accurately refl ects the skin’s elastic properties of each person than the current method that assumes a single empirical value. Using the thus calculated individual tIP, a set of simplifi ed skin visco- elastic parameters can be defi ned based on the area ratios calculated from each response curve. Statistically signifi cant correlation was obtained (by Pearson’s R test) when com- pared the Q2 results with the study volunteers’ chronological age. We have demonstrated that the area-based skin elasticity parameters, the Q-parameters in Cutometer, provide a simple and more accurate method for measuring skin elasticity. ACKNOWLEDGMENTS The authors would like to thank Greg Hillebrand, Rong Kong, Matt DePauw, Robin Ray, and Chithra Ganesan for their effort in helping collect Cutometer data from several large-scale clinical studies, and Barbara Olson for editing the manuscript. REFERENCES (1) V. Couturaud, J. Coutable, and A. Khaiat, Skin biomechanical properties: in vivo evaluation of infl uence of age and body site by a non-invasive method. Skin Res. Technol., 1, 68–73 (1995). (2) P. Elsner, D. Wilhelm, and H. Maibach, Mechanical properties of human forearm and vulvar skin. Br J. Dermatol., 122, 607–614 (1990). (3) A. Cua, K. Wilhelm, and H. Maibach, Elastic properties of human skin: relation to age, sex, and ana- tomical region. Arch Dermatol. Res., 282, 283–288 (1990). (4) G. E. Pierard, F. Henry, D. Castelli, and G. Ries, Ageing and rheological properties of facial skin in woman. Gerontology, 44, 159–161 (1998). (5) N. Krueger, S. Luebberding, M. Oltmer, M. Streker, and M. Kerscher, Age-related changes in skin mechanical properties: a quantitative evaluation of 120 female subjects. Skin Res. Technol., 17, 141–148 (2011). (6) H. S. Ryu, Y. H. Joo, S. O. Kim, K. C. Park, and S. W. Youn, Infl uence of age and regional differences on skin elasticity as measured by the Cutometer. Skin Res. Technol., 14, 354–358 (2008). (7) B. C. Murray and R. R. Wickett, Sensitivity of Cutometer data to stratum corneum hydration level. Skin Res. Technol., 2, 167–172 (1996). Figure 5. Age correlation of skin viscoelastic parameters from a panel of 463 female Caucasian volunteers. The solid dots are the values of elastic recovery (ER) of skin and the crosses are the viscoelastic recovery.
Purchased for the exclusive use of nofirst nolast (unknown)
From: SCC Media Library & Resource Center (library.scconline.org)