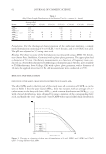
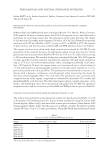
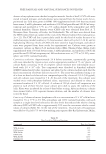
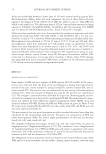
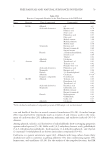
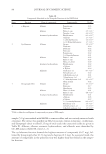
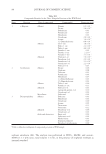
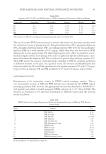
FREE RADICALS AND NATURAL SUBSTANCES IN PELOIDS 77 Table VI Results of the Textural and Chemical–Physical Analyses of the WM Peloid WM FC II FC III FC IV Mean Standard deviation Sand 49.1 49.1 15.5 41.7 24.6 Silt 39 39 72.4 48.6 22.9 Clay 11.9 11.9 12.1 9.8 2.8 Texture Silty sand Sand silt clay Sandy silt Humidity (%) 145 150 155 150 5 pH 4.2 6.2 4.1 4.6 1.1 N tot (%) 8 11 18 12.3 5.1 Li 7.7 7.9 6.5 7.4 0.8 V 12.4 11.4 12.9 12.2 0.8 Mn 14.4 13.3 11.1 12.0 1.7 Fe 2865 2975 3100 2980 117.6 As 8.6 10.6 12.1 10.4 1.8 Rb 29.9 28.2 28.6 28.9 0.9 Sr 56.8 55.9 70.9 61.2 8.4 Cs 16.3 18.5 14.1 16.3 2.2 Ba 19.3 22.4 21.5 21.1 1.6 Pb 6.3 8.5 5.7 6.8 1.5 U 1.5 2.5 1.8 1.9 0.5 Al 6870 7150 7320 7113.3 227.2 The minor and trace elements are reported in mg/kg. Table V Results of the Textural and Chemical-Physical Analyses of the DM Peloid DM FS I FS II FS III FS IV Mean Standard deviation Sand 3.3 45 36.4 48 33.2 20.5 Silt 78.4 36.8 40.6 39.5 48.8 19.8 Clay 18.3 18.2 23 12.5 18.0 4.3 Texture Silt Silty sand Sandy silt Silty sand Humidity (%) 144 146 148 143 145 2.2 N tot (%) 5 15 18 9 11.8 5.9 pH 4 5.7 6.6 5.1 5.4 1.1 Li 8.7 6.8 7.9 9.1 8.1 1.0 V 13.7 15.2 18.1 22.1 17.3 3.7 Mn 15.2 18.2 22.1 18.1 18.4 2.8 Fe 2969 3550 3489 3780 3447.0 342.4 As 6.6 12.1 11.9 12.2 10.7 2.7 Rb 27.7 32.3 35.1 40.1 33.8 5.2 Sr 54.5 60.1 65.2 70.2 62.5 6.7 Cs 17.3 18.2 19.5 21.5 19.1 1.8 Ba 21.2 21.2 20.1 18.9 20.4 1.1 Pb 7.1 8.2 9.2 11.2 8.9 1.7 U 1.2 2.1 3.1 2.8 2.3 0.8 Al 6700 8960 9250 8970 8470.0 1187.6 The minor and trace elements are reported in mg/kg. values of aluminum and iron were observed, followed by strontium, rubidium, barium, cesium, manganese, vanadium, arsenic, lithium, lead, and uranium. The composition and other general properties of the TSB are detailed in Supplemental #3, Supplemental Table A.

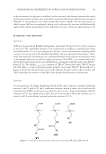
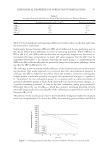
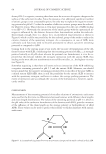
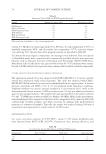
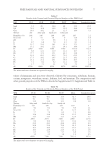
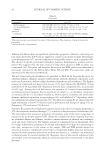
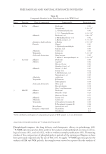
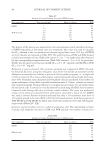
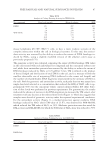
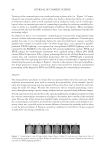
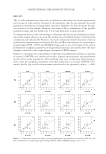
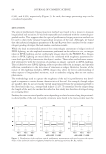
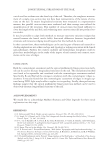
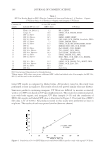
JOURNAL OF COSMETIC SCIENCE 78 DETERMINATION OF BIOACTIVE COMPOUNDS IN DM AND WM PELOIDS Natural compounds produced during microbiological growth in thermal muds are used in the benign effects in cosmetic applications and pelotherapy. Structural activity relationships between the organic composition and biological effects cannot be easily defi ned due to the high complexity of the system. Nevertheless, useful insights can be provided by identifi cation of specifi c compounds with well-known biological effects, such as antioxidant, radical scavenging, and anti-infl ammatory properties. In this con- text, the presence of sulfur in natural peloids originates interferences in GC-MS analy- sis, fully overlapping the peaks of organic compounds and increasing the chromatogram baseline. We avoided this side effect by treating DM and WM samples with appropri- ate solvents followed by chromatographic purifi cation and soxhlet extractions, by a slight modifi cation of the procedure reported for the muds of San Diego de los Baños (Pinar del Rio, Cuba) (14). Sulfur-free nonpolar (n-heptane, cyclohexane, and diisopro- pyl ether) and polar (EtOAc, acetone, and MeOH) fractions were obtained and analyzed by GC-MS using 6-methoxy purine as internal standard (DM and WM gas chromato- grams of diisopropyl ether, acetone, and MeOH fractions are shown in Supplemental #4, Supplemental Figures 14–19). To identify the chemical structure of the main com- ponents, two strategies were followed. First, the spectra of identifi able peaks were com- pared with commercially available electron mass spectrum libraries such as that of NIST-Fison. Spectra with at least 97% similarity index were chosen. Second, GC-MS analysis was repeated using commercially available standard compounds. In Tables VIII and IX are reported the compounds identifi ed in DM. The m/z values and peak abun- dances for selected compounds are reported in Table X and selected mass-fragmentation spectra in Supplemental #5. For the analysis of the polar fraction, the DM sample (5.0 g) was treated with n-heptane to remove sulfur, followed by sequential extraction with EtOAc, acetone, and MeOH (the extraction yields are given in Table I). The fractions (10 mg) were analyzed using GC-MS (Table VIII, entries 1–3). We identifi ed alkanols, carboxylic acids (and ester derivatives), terpenoids, phenols, alkaloid (colchicine), and sulfur derivative (octathiocane). The highest amount of compounds was in EtOAc (8.98 mg), followed by MeOH (0.59 mg) and acetone (c.a. 0.2 mg). Carboxylic acids (and ester derivatives) are well known for their biological properties, including the ability to quench reactive radical species (23,24), as in the case of the inhibition of lipoxygenase-catalyzed lipid degradation (25). For this reason, they are used for the Table VII Diameter of the Grains Corresponding to 60% of Passing (D 60%) and 10% (D 10%) and Coeffi cient of Uniformity (U) Sample D 60% (mm) D 10% (mm) U FS I 0.011 0.002 7 FS II 0.125 0.002 83 FS III 0.04 0.002 27 FS IV 0.08 0.002 53 FC II 0.18 0.002 120 FC III 0.18 0.002 120 FC IV 0.018 0.002 12
Purchased for the exclusive use of nofirst nolast (unknown)
From: SCC Media Library & Resource Center (library.scconline.org)