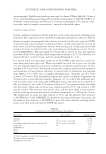
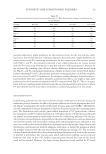
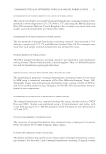
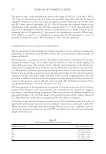
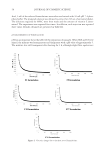
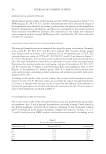
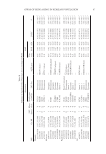
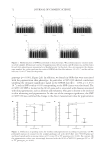
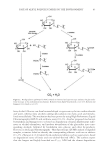
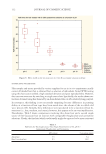
ANTIPOLLUTION COSMETIC EFFECTIVITY AGAINST AIR POLLUTANT ABSORPTION 41 Figure 1. Permeation curves (μg cm-2) obtained for the studied HAPs at 3–15 mg m-3 air concentration in control (black diamond), and cosmetic A (red diamond) and B (white diamond) samples.

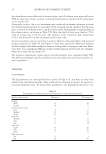
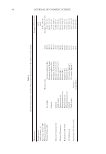
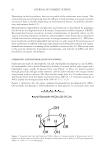
JOURNAL OF COSMETIC SCIENCE 42 with a maximum of 18 h. From experimental data, fl ux values have been obtained for control and cosmetic samples for all the evaluated HAPs (see Table 4), and Student t-test was calculated to determine whether values obtained for treated and control samples were statistically different at a P-value lower than 0.05. As it can be seen, fl ux values for cosmetic B are signifi cantly lower than those obtained for cosmetic A and control samples. A reduced fl ux value implies a higher antipollution effi cacy because it reduces the amount of HAPs absorbed per unit time. Table 5 shows the lag time values obtained from the experimental data for the control and cosmetic sam- ples. As it can be seen, lag time values for the control and cosmetic A sample are similar, with lower than 10 min for all the evaluated analytes. However, lag time values obtained for cosmetic B sample are signifi cantly higher than those of the con- trol sample, with values in the range of 33–74 min, which demonstrates high anti- pollution effectivity of cosmetic B. E FFECT OF PHYSICOCHEMICAL PARAMETERS OF HAPS ON PERMEABILITY VALUES A lthough it is not the main aim of this study, it should be commented that the main physicochemical parameters affecting permeability values (fl ux, lag time, and permeabil- ity at equilibrium) of organic compounds through the skin are related to its molecular weight and octanol–water partition coeffi cient (KOW) (17,18). For volatile organic com- pounds, a good indicator of dermal fl ux is the stratum corneum–air partition coeffi cient (KSC_G) (19,20), which is directly related to the stratum corneum–water partition coeffi - cient (KSC_W) and water–air partition coeffi cient (KW_G). A s KSC_W is directly related to KOW and KW_G is related to Henry’s law constant (HCP), it can be assumed that for compounds with similar KOW [from 1.47 for 1,2-dichloroethane Table IV Concentration of HAPs in the Exposition Chamber and Flux (J) Experimentally Calculated in Control and Cosmetic-Treated Strat-M Membranes, and t-Test Comparison Test HAPs [HAPs] (mg m-3 ± s) J [μg cm-2 h-1 ± s] Control Cosmetic A t-testa Cosmetic B t-testa t-testa (cosmetic A vs B) 1,2-dichloroethane 15 ± 3 0.566 ± 0.007 0.48 ± 0.01 17.258 0.324 ± 0.009 51.990 28.403 Benzene 12 ± 3 0.140 ± 0.006 0.118 ± 0.005 6.900 0.099 ± 0.003 14.971 7.982 Bromodichloromethane 14 ± 3 0.377 ± 0.006 0.30 ± 0.01 15.543 0.243 ± 0.009 30.345 10.378 Toluene 12 ± 2 0.138 ± 0.008 0.10 ± 0.01 7.268 0.084 ± 0.009 10.985 2.913 1,2-dibromoethane 13 ± 3 1.2 ± 0.2 0.6 ± 0.1 6.573 0.33 ± 0.02 6.573 4.677 Chlorobenzene 14 ± 3 0.24 ± 0.04 0.17 ± 0.02 3.834 0.13 ± 0.02 6.025 3.464 Ethylbenzene 13 ± 2 0.114 ± 0.005 0.075 ± 0.002 17.740 0.056 ± 0.005 20.092 8.642 m+p-xylene 25 ± 4 0.25 ± 0.04 0.18 ± 0.06 2.378 0.11 ± 0.02 7.668 2.711 Bromoform 13 ± 4 1.4 ± 0.3 0.7 ± 0.1 5.422 0.5 ± 0.2 5.978 3.944 o-xylene 14 ± 3 0.21 ± 0.02 0.15 ± 0.03 4.076 0.10 ± 0.01 12.050 3.873 Nitrobenzene 3 ± 1 5.1 ± 0.3 4.0 ± 0.1 8.521 3.5 ± 0.2 10.870 5.477 Naphthalene 12 ± 3 1.1 ± 0.1 0.6 ± 0.1 8.660 0.45 ± 0.05 14.241 3.286 a Student t critical values equal to 2.230 (n = 10) .
Purchased for the exclusive use of nofirst nolast (unknown)
From: SCC Media Library & Resource Center (library.scconline.org)