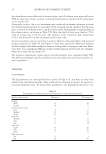
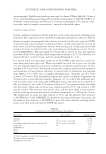
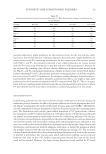
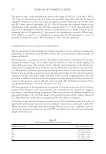
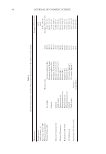
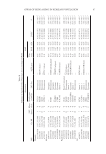
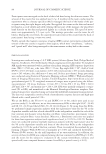
Table II Summary of Signifi cant Skin Phenotype Loci according to GWAS SNP Chr:BP SNP clusterallele a Minor Annotation eQTL gene MAF β (SE) b P Nearby gene (500 kb) SNP Pos. This study KOR ASN Wrinkle rs117381658 1:157,353,684 5 T FCRL5 Downstream — 0.07 0.04 0.01 0.952 (0.167) 1.52 × 10⁻⁸ rs1961184 10:63,733,371 2 T REEP3 Downstream REEP3 (heart) 0.08 0.05 0.07 0.840 (0.164) 3.60 × 10⁻⁷ rs1929013 1:244,230,708 15 G ADSS Downstream — 0.34 0.35 0.33 -0.410 (0.092) 8.29 × 10⁻⁶ rs7042102 9:92,001,508 4 T SPTLC1 Downstream SPTLC1 (skin) 0.41 0.44 0.45 0.392 (0.088) 9.30 × 10⁻⁶ Moisture rs9873353 3:31,233,850 3 T — Intergenic — 0.07 0.02 0.02 -0.567 (0.117) 1.47 × 10⁻⁶ rs34567709 17:61,492,168 5 G TBX4 Downstream TBX4 (adrenal gland)0.14 0.12 0.14 0.406 (0.086) 2.53 × 10⁻⁶ rs1362404 16:51,973,264 3 G — Intergenic — 0.24 0.28 0.29 -0.319 (0.069) 3.76 × 10⁻⁶ rs7853290 9:71,638,804 1 A TRPM3 Upstream CEMIP2 (adipose) 0.08 0.07 0.09 0.533 (0.115) 3.96 × 10⁻⁶ rs143938096 15:79,098,451 4 A CTSH Upstream — 0.07 0.08 0.06 -0.534 (0.116) 4.40 × 10⁻⁶ rs12955989 18:24,106,190 4 G TTC39C Intron 5 CABYR (artery) 0.20 0.21 0.15 0.338 (0.073) 4.57 × 10⁻⁶ Pigmentation rs74653330 15:27,983,407 6 T OCA2 Exon 15 (missense) — 0.07 0.07 0.03 -1.092 (0.189) 1.04 × 10⁻⁸ rs34466224 19:3,219,644 13 A NCLN Downstream NCLN (skin) 0.22 0.22 0.22 0.602 (0.124) 1.33 × 10⁻⁶ rs11685354 2:217,996,408 7 A TNS1 Intron 1 RUFY4 (lung) 0.43 0.41 0.45 -0.477 (0.099) 1.82 × 10⁻⁶ rs4653497 1:227,355,326 6 T CDC42BPA Upstream CDC42BPA (skin) 0.49 0.49 0.44 0.446 (0.098) 6.51 × 10⁻⁶ rs59784607 16:25,774,628 4 T HS3ST4 Intron 1 — 0.21 0.19 0.13 -0.541 (0.121) 8.13 × 10⁻⁶ rs76548385 7:1,291,682 10 T UNCX Downstream — 0.09 0.09 0.07 0.768 (0.173) 9.92 × 10⁻⁶ Oil rs308971 3:12,075,120 7 G SYN2 Intron 1 SYN2 (skin) 0.24 0.26 0.19 -0.325 (0.071) 4.60 × 10⁻⁶ rs151209785 18:74,549,791 8 C CNDP1 Intron 1 — 0.07 0.03 0.02 -0.556 (0.121) 5.19 × 10⁻⁶ rs9577919 13:113,861,036 1 T GAS6 Intron 1 TMEM255B (skin) 0.06 0.05 0.07 0.598 (0.133) 7.92 × 10⁻⁶ rs8107564 19:6,964,536 5 A INSR Downstream — 0.11 0.11 0.09 0.430 (0.097) 9.67 × 10⁻⁶ rs6490805 13:23,510,670 4 C TNFRSF19 Upstream — 0.18 0.16 0.15 0.352 (0.079) 9.84 × 10⁻⁶ GWAS OF SKIN AGING IN KOREAN POPULATION 67

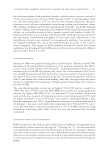
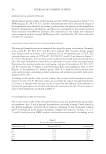
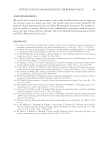
SNP Chr:BP SNP clusterallele a Minor Annotation eQTL gene MAF β (SE) b P Nearby gene (500 kb) SNP Pos. This study KOR ASN SNP Chr. pos SNP cluster a Minor allele Annotation eQTL gene MAF OR (95% CI) c P Nearby gene (500 kb) SNP Pos This study KOR ASN Sensitivity rs7334780 13:106,182,099 2 T Intergenic — 0.32 0.33 0.33 0.635 (0.525–0.768)2.82 × 10⁻⁶ rs41308 7:28,636,081 5 C CREB5 Intron 4 — 0.36 0.36 0.35 1.564 (1.295–1.890)3.57 × 10⁻⁶ Chr: chromosome BP: base pair Pos: position KOR: Korean ASN: Asian SE: standard error. The reference MAF was obtained from the KRGDB (http://coda.nih. go.kr/coda/KRGDB/index.jsp) and Ensembl DB (https://asia.ensembl.org). a SNP cluster is the number of SNPs that satisfy p 0.05 at ±100 kb around the top signal SNP indicated in GWAS. b Calculated β and SE by linear regression. c We analyzed OR using logistics regression. The SNPs with the top signals based on GWAS satisfying the cutoff value of p 5.0 × 10⁻⁸are underlined. Table II Continued JOURNAL OF COSMETIC SCIENCE 68
Purchased for the exclusive use of nofirst nolast (unknown)
From: SCC Media Library & Resource Center (library.scconline.org)