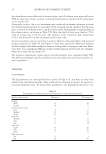
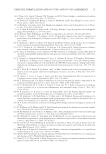
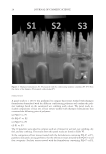
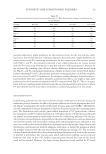
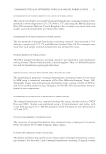
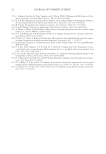
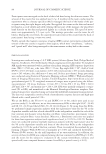
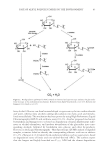
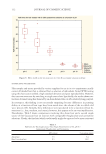
GWAS OF SKIN AGING IN KOREAN POPULATION 71 Table III Normalization and Classifi cation of Skin Measurements Phenotype Code Evaluation Target phenotype for GWAS Tertile criteria Total score formula Total score range (min ~ max) Wrinkle W101 1: 0 d x 17.89 (W101 tertile) 4–12 2: 17.89 d x 22.34 + 3: 22.34 d x W102 1: 0 d x 157.83 (W102 tertile) 2: 157.83 d x 213.25 + 3: 213.25 d x W103 1: 0 d x 21.19 (W103 tertile) 2: 21.19 d x 27.75 + 3: 27.75 d x W104 1: 0 d x 155.36 (W104 tertile) 2: 155.36 d x 206.54 3: 206.54 d x Moisture A101 3: 0 d x 61.53 (A101 tertile) 2–6 2: 61.53 d x 70.07 + 1: 70.07 d x A102 3: 0 d x 67.46 (A102 tertile) 2: 67.46 d x 73.67 1: 73.67 d x Pigmentation M101 1: 0 d x 148.33 (M101 tertile) 4–12 2: 148.33 d x 179.00 + 3: 179.00 d x M102 1: 0 d x 106.00 (M102 tertile) 2: 106.00 d x 131.00 + 3: 131.00 d x R201 3: 0 d x 58.81 (R201 tertile) 2: 58.81 d x 60.93 + 1: 60.93 d x R202 3: 0 d x 62.34 (R202 tertile) 2: 62.34 d x 64.34 1: 64.34 d x Oil L101 1: 0 d x 52.00 (L101 tertile) 2–6 2: 52.00 d x 92.33 + 3: 92.33 d x L102 1: 0 d x 27.00 (L102 tertile) 2: 27.00 d x 51.00 3: 51.00 d x Sensitivity S101 1: nonsensitive, 2: sensitive 1 or 2 min: minimum max: maximum. cluster of fi ve SNPs within ±100 kb that showed a signifi cant correlation of p 0.05 in the GWAS. The genes that showed an association were FCRL3, which mediates an infl ammatory response REEP3, which is involved in cell division and aging ADSS2, which is involved in adenosine regulation and SPTLC1, which is involved in mainte- nance of moisture and skin function. Moreover, in the case of rs117381658, a difference for the value was found as a result of measuring the wrinkle condition of the skin by genotype (Supplementary Figure 2). In particular, in the analysis of variance test of the grading scale value of wrinkle measurement, the wrinkle value increased according to the

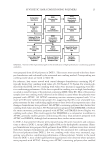
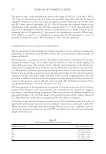
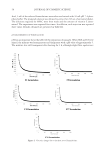
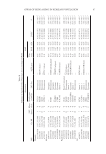
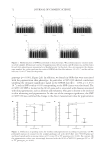
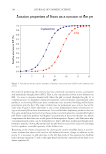
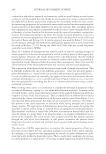
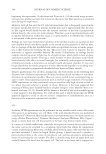
JOURNAL OF COSMETIC SCIENCE 72 genotype (p 0.001, Figure 2A). In addition, we found six SNPs that were associated with the pigmentation skin phenotype. In particular, rs74653330 showed correlations satisfying the strongest signifi cance signal in the GWAS data (β = -1.092, p = 1.04 × 10⁻⁸), and six SNPs with p 0.05 corresponding to the SNP cluster were also found. The rs74653330 SNP is located in the OCA2 gene and is associated with diseases associated with skin pigmentation, such as albinism and melanoma. This gene is known to be involved in skin whitening and pigmentation. In the case of the strongest signifi cance, the SNP rs74653330 was confi rmed the change in the direct measurement value for pigmentation Figure 1. Manhattan plots of GWASs performed on skin phenotype. We performed genetic variation analy- sis of (A) wrinkles, (B) moisture content, (C) pigmentation, (D) oil content, and (E) sensitivity, and the results for each skin phenotype are represented in a Manhattan plot. In the plots, the x-axis represents the chromo- some number the y-axis represents the results of GWAS the blue line indicates 1.0 × 10⁻⁵, and the red line indicates 1.0 × 10⁻⁸ based on the p-value. Figure 2. Differences in grading scales for wrinkles and pigmentation according to genotype. (A) We performed analysis of variance for the wrinkle grading scale with the FCRL5 rs117381658 genotype and found signifi cantly increasing values in CC versus CT or TT genotypes (p 0.001). By contrast, (B) the pigmentation values were increasingly decreased with the OCA2 rs74653330 genotype (CC vs. CT or TT genotypes p 0.001).
Purchased for the exclusive use of nofirst nolast (unknown)
From: SCC Media Library & Resource Center (library.scconline.org)