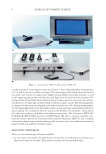
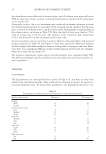
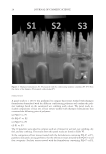
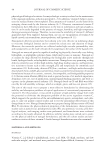
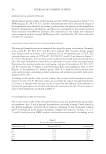
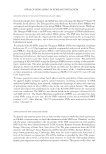
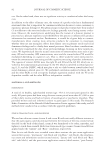
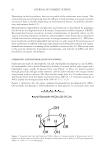
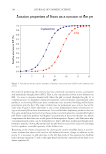
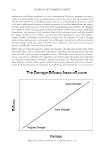
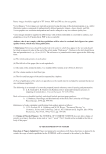
PHARMACEUTICALLY OPTIMIZED TOPICAL NANOGEL FORMULATION 55 CONTENT QUANTITY DETERMINATION A validated HPLC method was used to measure the concentration of v itamin C in aque- ous phase. The determination correlation coeffi cient (r2) for the regression line was 0.9998 with the linear regression equation y = 11177.7 + 154703x. The method was validated according to International Conference on Harmonisation guidelines with respect to lin- earity (r2 = 0.9998), specifi city, precision as repeatability and reproducibility (coeffi cient of variation d 2%), accuracy (coeffi cient of variation d 2%), and stability (27). The limit of detection and the limit of quantifi cation of citamin C were found to be 0.061 and 0.123 μg/mL, respectively. Table IV pH Results of Formulations Formulation code PH F1 5.4 ± 0.004 F9 5.95 ± 0.003 F19 5.95 ± 0.007 F27 5.4 ± 0.011 F31 5.4 ± 0.005 Figure 1. Three-dimensional AFM image of formulations.

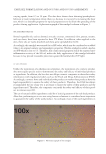
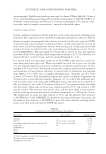
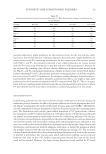
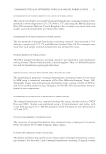
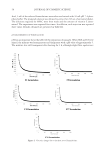
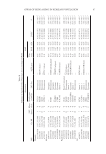
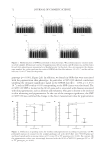
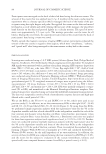
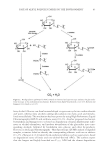
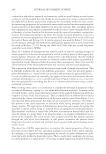
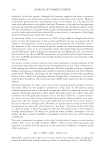
JOURNAL OF COSMETIC SCIENCE 56 Figure 2. Viscosity change due to the shear rate of formulations. And, 1 mL of the selected formulations were taken and mixed with 10 mL pH 7.4 phos- phate buffer. The prepared solution was allowed to extract for 24 h on a horizontal shaker. The dilutions required for HPLC were then made and the amount of vitamin C deter- mined. The experiment was repeated fi ve times. In addition, each injection was repeated three times. Results obtained are presented in Table III. pH MEASUREMENTS OF FORMULATIONS pH was an important factor that affected the preparation of nanogels. When BSA and CS were mixed, the mixture was homogeneous and transparent with a pH value of approximately 5. The mixture was still transparent after heating for 1 h, although slight blue opalescence
Purchased for the exclusive use of nofirst nolast (unknown)
From: SCC Media Library & Resource Center (library.scconline.org)