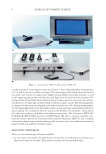
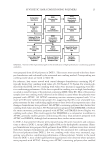
GWAS OF SKIN AGING IN KOREAN POPULATION 69 IDENTIFICATION O F SNP GENOTYPE BASED ON SNP ARRAY Oral swab sample s were obtained, and DNA was extracted using the Exgene™ Tissue SV (GeneAll, Seoul, Korea). The Theragen Precision Medicine Research Array (PMRA) was customized and designed based on the Asian PMRA (Thermo Fisher Scientifi c, Waltham, MA) to obtain genetic variant information for 820,000 SNPs in the entire human genome. The Theragen PMRA array is an SNP array, which is the convergence of DNA hybridization, fl uorescence microscopy, and solid-surface DNA capture. The SNP array has three major components: an allele-specifi c oligonucleotide probe, fragmented nucleic acid sequences labeled with fl uorescent dyes, and a detection system that records and interprets the hybridization signal. To identify 820, 000 SNPs using the Theragen PMRAs, DNA was amplifi ed, randomly broken into 25- to 125-bp fragments, purifi ed, resuspended, and reacted with the Thera- gen PMRA to bind human genomic DNA to the fl uorescently labeled allele-specifi c oli- gonucleotide probe. DNA that bound to the probe was hybridized to prepare for detection. Following hybridization, the bound targets were washed to remove unbound DNA frag- ments to minimize noise that results from nonspecifi c ligation events. We performed genotyping of 820,000 SNPs using the Theragen PMRA array according to the manufac- turer’s instructions. The array provides genome-wide coverage in fi ve major populations (European, American, South Asian, East Asian, and African). In addition, the genotyping results, obtained with the array, confi rmed that the accuracy of the 7.4 million markers in an Asian population, with minor allele frequencies (MAFs) 1% and 5% were 0.90 and 0.94, respectively. To reduce potent ial concern about batch effects and the possibility of false associations, we applied highly stringent quality control measures, including assessment of DNA quality and probe binding, noise removal, confi rmation of genotype accuracy, and correction of genotyping errors to select SNPs to use in the case and control datasets. The quality control procedures were performed for each of the 820,000 SNPs before the association tests were conducted. The SNP set was fi ltered based on the genotype call rates (t0.95) and MAF (t0.10). The Hardy–Weinberg equilibrium (HWE) was calculated for indi- vidual SNPs using an exact test. All the SNPs reported in this article exhibited HWE p-values 0.01. After fi ltering, 560,795 polymorphic SNPs were analyzed on chromo- somes 1 through 22. ANNOTATION OF SNP-A SSOCIATED GENES To identify and ann otate genes that are functionally related to SNPs that show signifi cance in GWASs, it was necessary to check the information of the SNP locus. Therefore, to iden- tify the genes corresponding to the top p-value of the SNP associations in each analysis, SNP locus data were obtained from the UCSC Genome Browser (Genome Bioinformatics Group, University of Santa Cruz, Santa Cruz, CA). The gene annotations from the UCSC database and Genotype-Tissue Expression (GTEx) database (GTEx Analysis Release v. 8, http://www.gtexportal.org/, Cambridge, MA) were also used to predict the functional ef- fects of the variants on transcripts. The GTEx database is provided by the GTEx project and provides the scientifi c community with resources to study the relationship between human gene expression and regulation and genetic variation. This project will collect and

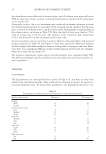
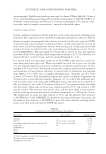
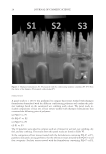
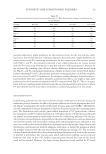
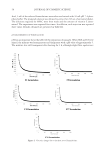
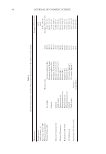
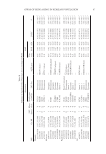
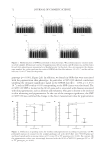
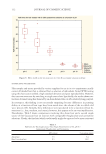
JOURNAL OF COSMETIC SCIENCE 70 analyze multiple human tissues from donors who are densely genotyped to assess genetic variation within their genomes. By analyzing global RNA expression within individual tissues and treating the expression levels of genes as quantitative traits, variations in gene expression that are highly correlated with genetic variation can be identifi ed as expression quantitative trait loci (eQTLs). Our gene expression data are based on this GTEx database. STATISTICAL ANALYSI S Three groups based on tertiles were delimited and scored based on the range of measure- ments and the number of samples for each skin phenotype. The total score was calculated by integrating the measured scores of the skin phenotypes (Table III). In addition, we performed association analysis through linear regression between the total score for the “target phenotype for GWAS” and the genetic variants, and the results of this analysis were adjusted by age. Most of the statistical analyses were performed using PLINK version 1.9 (https://www.cog-genomics.org/plink/) and SPSS (IBM SPSS Statistics Inc., New York, NY). p-values were not adjusted for multiple tests. p 1.0 × 10⁻⁵ was considered statistically signifi cant. RESULTS STUDY POPULATIO N AND TH E RESULTS OF SKIN MEASUREMENTS Table I summarizes the measurement information for the skin indicators wrinkles, moisture content, melanin/erythema, pigmentation, brightness, oil content, and sensitivity. In this study, we analyzed 1,079 subjects with a mean age of 40.81 years. The skin phenotypes were measured for each feature at two different sites, and the mean and standard deviation (SD) were recorded in units of the measuring devices. The average and SD values of the measurements for the fi ve skin phenotypes of wrinkles, moisture content, pigmentation, oil content, and sensitivity are presented in Table I. In addition, we assigned codes to each measurement item to unify the different values for each phenotype and measurement in- strument (Table I). In addition, we identifi ed the distribution of the measurements for each code to identify trends in skin phenotypic changes with age (Supplementary Figure 1). GWAS FOR EACH SKIN PHEN OTYPE We performed a GWAS of Korean women, in whom the skin traits wrinkles, moisture content, pigmentation, oil content, and sensitivity were measured (Table III). A total of 23 SNPs showed signifi cant p-values (p 1.0 × 10⁻⁵) according to the GWAS of the skin phenotype (Table II and Figure 1), which matched the MAFs in the reference database [Korean Reference Genome Database (KRGDB) http://coda.nih.go.kr/coda/KRGDB/index. jsp Ensembl DB, https://asia.ensembl.org]. For the wrinkle phenotype, we found four SNPs, rs117381658 (FCRL5), rs1961184 (REEP3), rs1929013 (ADSS), and rs7042102 (SPTLC1), among which rs117381658 showed the most signifi cant correlation (β = 0.952, p = 1.52 × 10⁻⁸) with skin phenotype changes for wrinkles (Figure 2A) and presented a
Purchased for the exclusive use of nofirst nolast (unknown)
From: SCC Media Library & Resource Center (library.scconline.org)