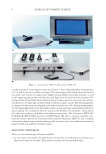
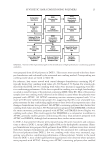
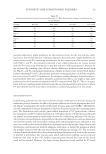
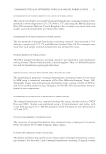
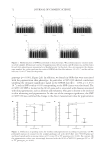
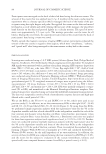
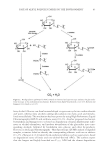
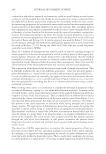
LUXURY CUES OF CREAM HEIGHTEN THE REWARD VALUE 83 task block and “post-Basic” task block). A black screen was shown for 45 s after each task block to indicate a reset and for 5 s before the fi rst task block. During the second session, information on each cream was provided. The information consisted of a word represent- ing the cream (“Luxury cream” or “Basic cream”), a photo of the cream’s case (a glass or plastic container) in a gray square, a statement of the intended effect of the cream (“make your skin soft and smooth” or “make your skin moist”), and price (¥20,000 or ¥2,000) written on a black background. For the fi rst and third sessions, a gray square on a black background was shown as a visual control. Visual stimuli were projected onto a display mounted in goggles attached to the participant’s head (Figure 1). Figure 1. The three sessions of the study. In the second session, participants were given product information visually during the massage. In the fi rst and third sessions, participants were given the same view without the product information.

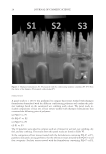
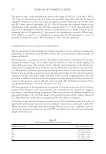
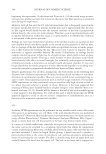
JOURNAL OF COSMETIC SCIENCE 84 Pa rticipants were massaged on the back of their left hand using the skincare creams. The amount of the cream that was applied was 0.2 g. A member of the team conducting the experiment who is a beauty specialist (M.S.) massaged the back of the hands of the par- ticipants using her right fi ngers and palm. She applied the cream on the skin and moved her hand in a circle slowly and softly. During the last part of the massage, she placed her hand directly on the skin and pressed lightly in a circular motion. The speed of move- ment was approximately 2.5 s per cycle. The massage procedure was the same for all blocks. During the reset block, the experiment team removed the cream from the back of participants’ hand using a warm wet towel. Fi nally, outside the magnetic resonance imaging (MRI) scanner, participants evaluated the texture of the two creams in regard to three aspects, which were “smoothness,” “softness,” and “spread well” after being massaged in the same manner as they had in the scanner. FM RI DATA ANALYSIS Sc anning was conducted using a 3.0-T MRI system (Achieva Quasar Dual Philips Medical Systems, Eindhoven, The Netherlands). Blood-oxygenation-level-dependent T2-weighted MR signals were measured with a gradient echo-planar imaging (EPI) sequence [repetition time (TR) = 2,500 ms, echo time (TE) = 35 ms, fl ip angle (FA) = 90°, fi eld of view (FOV) = 230 × 230 mm2, scan matrix = 128 × 128, total scan time = 635 seconds, dynamic scans = 245 volumes, slice thickness = 5 mm, and 24 slices per volume). Image processing was conducted using Statistical Parametric Mapping software (SPM12, Wellcome Depart- ment of Imaging Neuroscience, London, United Kingdom http://www.fi l.ion.ucl.ac.uk/ spm/software/spm12). T1-weighted anatomical images were acquired using the follow- ing parameters: 150 slices, thickness, 1.0 mm, TE = 2.0 ms, TR = 23 ms, FOV = 240 × 240 mm2, FA = 30°, and matrix size = 240 × 240. EPIs were spatially realigned, co-regis- tered (T1 to EPI), and normalized to the Montreal Neurological Institute template. Nor- malized images were smoothed using an 8-mm full-width half-maximum Gaussian kernel. The data were temporally convolved with a hemodynamic response function and high-pass fi ltered with a cutoff period of 128 s. We set the ROIs as the VS (10 4 -2) and DLPFC (33 15 45), which were used in our previous study (1). In addition, we set the somatosensory ROIs as the right SI (47 -39 46) and SII (52 -24 20) and the left SII (-58 -20 14) (4) (Figure 2). By using these fi ve ROIs, we performed simple regression analyses with the eigenvariate value for the VS as the dependent variable and that of each other ROI as the independent variable for each of the four contrasts (pre-Luxury versus baseline, pre-Basic versus baseline, post-Luxury versus baseline, and post-Basic versus baseline). Moreover, a Bonferroni correction was applied for these four regression analyses (each signifi cance level: p 0.05/4 = 0.0125). Further- more, we conducted stepwise multiple regression analyses with the eigenvariate value for the VS as the dependent variable and those of the other four ROIs as the independent variables (p 0.05) for each of the four contrasts. Then, we analyzed the residuals by per- forming a Shapiro–Wilk (S-W) test of normality (p 0.05) and calculated the Durbin– Watson (D-W) statistic for the null hypothesis of no autocorrelation. In addition, the activity of these fi ve ROIs was compared among the four contrasts by ANOVA (p 0.05), and the scores for the subjective evaluation of the texture (smoothness, softness, and spread well) were compared between creams A and B by a paired t-test (p 0.05).
Purchased for the exclusive use of nofirst nolast (unknown)
From: SCC Media Library & Resource Center (library.scconline.org)