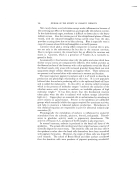
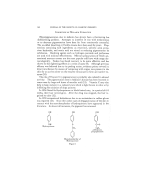
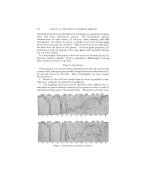
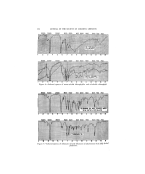
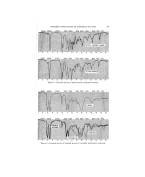
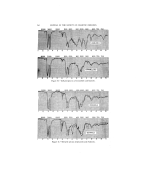
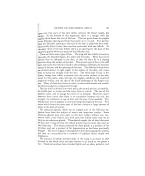
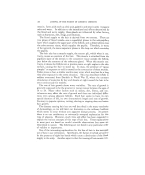
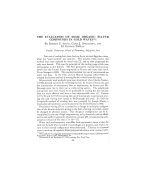
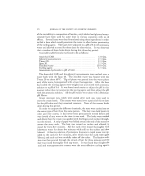
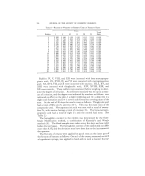
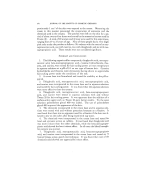
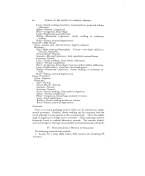
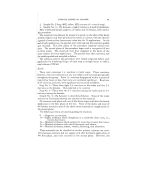
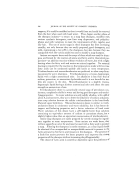
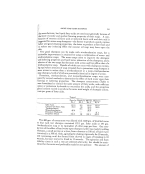
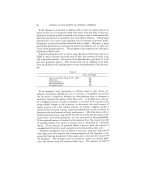
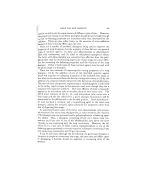
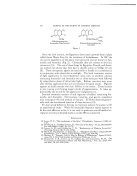
260 JOURNAL OF THE SOCIETY OF COSMETIC CHEMISTS 4 5 7 8 9 I0 II 12 IS 14 15 3OOO IOOO 900 4 5 t3 7 8 9 I0 II IE 13 Figure 10.--Infrared spectra of citronellols and linalools. ß 5000 3oo( IIIIIIl'11•11111 II11111111111i IIIIIIIIIIIIII IIIIIIIII11111t IIIIIIIIIIII IIIIIIIIIILIJ IIIIIIII IIIII IIIIIIIIIIII1• I I I I I I I I II I 1111 !1 IllIfil I• fill I I I I I I I I lllllllll I I I I I I I I Ili•11111 I r I I I I I I IIIIIIIII r I I I I I I I Ilii'11111 I I I • I I I I I•1/11111 I I I I I I I I IJll•JI I fitill 1 i I '•,1 2000 1500 1300 1100 I000 900 800 750 700 IL-I-/ t:J•LI I I I I I I I I I I I I I I I I ! I I I I I I I I I I I I I'1 I I i II1•1 •1 • •1111111 IIIIII IIIII I/I I r i i i i i i•.',,-l•l i i ] i i i i i i i ii i i i i i i i i i i i i i i i i i IIIIIIII ß l i•lll ill\lrl//f J•llllllllllllllll iiil•l_lllll lil II I111L '11 I J I I I I I I i'ql/I I •11 I i I I I I III I I I I I I I I I/•--,F2•,r4 I I I J I I I I IIIII I I II I I I I I I I11/I I Ill I I I I I I I),,L•I I I I I I i I I ,•/I I NI'-,'L•I I I I-,L--H•-•I I I I I I I I I I I I I Ill r I III I I r i l"'•"Y%l I I I I I I I•11 FI 1'•11 F.i-'.l.-.•.l--i•x •'-r i i III II I IIII fill I I I v.• I•.4. FI•I I I r ll I 14 I I I I I•-xjff/[ I II I 1.q I I IIII Ill I I I I I I II I 111[I I I½1 I"1 I I I•',-,I I I I I I Ill I I I I I rxx, F[ [ I ] I I I I i I I I I I I I III I I I/'11 I I f I I 1'-.'4 I I I I l,•JI I I I I I I'1::•11 I I I I I I I J I [ ) , I I I Ill I• /I I I I I r I I--,.I]11 I I.qA/I I I I I I I I I I I I I I [ I I I I I I I ,l I, I Ii Ii I I I I I I I I I I I Ill I•l/I i I I I I I I I Ill I I l/I//] I I I I I I I I I I i I Ill!• Illllllllllll Ill I ,41•/lllllllllllll [llll II r I I•1•1/J IIIIIIIII1! IIIIIIIl[lJ I I I I I I / I I I I I I Ill I I I I [ I I J III •%L•V/I I I I I I I RHODINOLS [ [ [ [ i ]J IL}111 Ill I I I I IIII/I 1•'.4/I Ill III I I I I I I I I III I I I I RJI ,'1111 I I I I I I I IIMI I"1 I I I I I I t I I I I I I I I I I I I I I I I I II11 II III III IIII I II1'11'111111111 lull II IIIIIIIIlllllllllllllllllll IIIIII1'11 II IIIIIIIIIIII I II IIIII IIIIIII1,1t1111,11,,,,,,,,,,,,,,,,,, ,,11 IIIII IIIII IIII II 5 6 7 8 9 I0 II 12 13 14 15 5000 3009 2opo 15oo 1300 IIQO 10,00 900 800 750 7QO IB•I•..Lt•LL•_• LIIIIIIl'1111111111111111lllllllllllllllllllllllll I I I I I I IIJ,.,'•l I I I I I L..3• I •1• I I I I I I I I I I I r I I I I I I I I I I I I I I I I I I I I I I I I I I I I III II I I I I I I I•l Ill I I I I L/t I I I I I I II\l lJ•J I I I I I I I I I I I I I I I I I I I I I I I I I I I I I I I I I I I I IIIII_L III1!1 IIII IIIl•fllll IIIIA•I•111 II!11111111111!1 IIIIIIIII IIIIIIli111111- I I I I I I I I I I I I I I11 I I I I I I I I IIIIbll I• I I ! I I I I I I I I I I I I I I I I I,KI I I I I I I I I I I--kl I-•,-l.-I.-I-I-J• I I I I I I I I I I I I I BI I I I I I I I I Illfi[11 I •l I I I I I I I I L/'lx I I I I I I I I I/A•J b,d.I I I I I I I I I I I I I I I I I i I I I I I I I I I III/1111 I III I I I I I.'r.I L'•.rl.'i''•l I I I I I I I igAT l/vrT%I I I I I I I I I I I I I •11 I I I I • I I I I IIIIIVl I III I I I I • f/''L'C. AIII I I I I I I I'--I'xl F'I I T''I /f'"3• '1'•1 I•'J[ I I I I I I I I I I # I I I I I I I III! I I III I I I'"'F• fiStrill I11 •'1 I I I I lB I II/•l III I'•''/"1 I I I I I I I I II I.•.' IIIIIII I II I IIIIIIIlIWI Ir'lll'l/lll!,,,.l!ll11111llflllll•t/1111111111111L II1 I !1 ]1 I I 11 III !/1111•JIIIIIIJ!111•11111111111111111•. Ill I I II Irl II/JIlIII•IIIIIIllIIII/RIIIIIIIIIIIIIIIIIIII Ill i i [lllllllllllll [/•g •] I I I Ilkd I 11111 I I I I I I I I I I I I IIIllllll I I I I I I Illlllll/ I I I I I I I I I III I I I I I YIIJ !11 IIIl•&11/I/I II Iil1111111. [ [ [ [ [ [ [ [ [ il]il[[fl i i i If [ [ [ [ [] [ ] I [ l![l'] J r &a i ) [) ] ["l'tl I/rl I [ GERANIOLS LI [ M [ &l [! • I t I i•,,-ft I I I IW [ [ • II ' •I]11 I I I I I I I I I I I I I t III I Ill/ I yl 1 v ß i Illllilll'•:l'llilllllllJlllllllllllll I FIIIIlllllllll Illl Illlllllllllll i1 IIII!111111l¾11111111111111!llirlJlllllllllltllllllllllllllllllllllllt 2 3 4 5 6 7 8 9 I0 II 12 13 14 Figure l l.--Infrared spectra of geraniols and rhodinols.

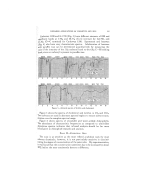
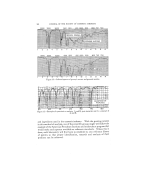
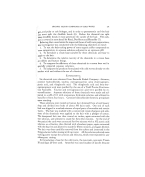
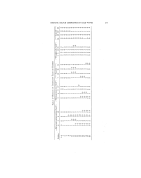
':i" INFRARED APPLICATIONS OF COSMETICS AND OILS 261 •:.•11•11:(c) Example of .•uantitative Analysis Figure 13 shows a two-component system in the 9-15 micron region where .... ?:A is one component and B the other. C was an unknown mixture of A and B which had to be determined. Absorbance paper was chosen for this ?ianalysis since absorbance values directly proportional to concentration '.: could be read directly off the paper. Assuming that the strong bands !::!: follow Beer's Law ideally, the concentrations of C could be calculated, using :a slide rule. This gave 25 4- 0.5% A and 75 4- 0.5% B at several wave~ .i!i lengths in a matter of minutes. A 25 to 75% mixture was then made and i:: recorded which repeated C almost perfectly, thus giving proof that the •.. analysis was correct. If heavier cells would be used, components A and B :i:: could be determined to a better accuracy of about 0.1% in a smaller con- '"'• centration rage. For better quantitative work, it is, of course, preferable to establish working curves with mixtures of accurately known concentra- ":tions which are plotted against the recorded absorbance values. Such .. curves are then usable, no matter how much the absorption deviates from Beer's Law, as long as experimental conditions can be reproduced for each analysis. ,:t INSTiKUMENTAL These spectra were obtained on a Model 21 Perkin-Elmer Infrared Spectrophotometer recording linear in wavelength and per cent trans- mission at an average resolution program requiring 10-15 minute scanning : :: time per spectrum. Sample thicknesses of 0.07.5 min. were used in most ß cases except for solids and viscous materials such as the lanolin which were examined in thin films between two NaC1 windows. SAMPLES The spectra shown were obtained with commercial grade samples which unfortunately were of unknown grade of purity. No attempt was made to produce standard reference spectra of pure materials, but rather to illus- trate applications. These spectra should still be generally useful in problems of identification. CONCLUSION These few applications illustrate the manner in which infrared s•)ec- troscopy can be applied to some problems in the cosmetic and perfume in- dustries. Many other applications are being found by instrument users at the present time, and such applications will probably increase tremen- dously in the very near future. Because there has been relatively little work published in this field to date, one of the major disadvantages at the present time is the lack of infi'ared reference spectra of pure essential oils
Purchased for the exclusive use of nofirst nolast (unknown)
From: SCC Media Library & Resource Center (library.scconline.org)