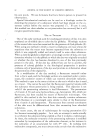
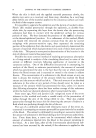
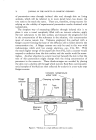
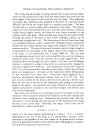
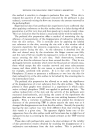
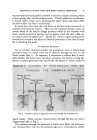
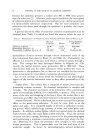
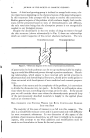
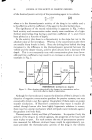
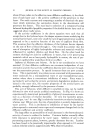
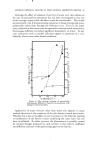
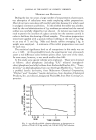
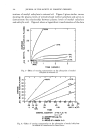
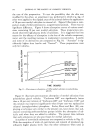
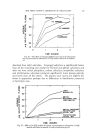
THE PERCUTANEOUS ABSORPTION OF SALICYLATES 99 Blood salicylate determinations were performed with a slight modifica- tion of the method of Brodie, Udenfriend and Coburn (5). In order to im- prove the sensitivity of the method, twice the amounts of plasma and all of the reagents described were employed and therefete it was possible to use 50 min. cuvettes with Bechmann DU spectrophotometer. This method could not be used to detect methyl salicylate because esters of salicylic acid do not react with the ferric nitrate reagent but rather remain in the ethylene chloride layer. Determinations of ester salicylate were made by measuring the optical density of this layer at 307 m • and therefore it was possible to determine free salicylate and ester salicylate simultaneously. Recently, Stolar, Rossi and Barr (10,11) have used rabbit plasma levels to study the percutaneous absorption of salicylic acid and sodium salicyl- ate. Their method differed from the present one in that the animals were unanesthetized and the absorbing area was covered by a specially designed bandage. This system or the similar one described here offers a useful tool for studying the percutaneous absorption of salicylates. RESULTS Following the intravenous injection of methyl salicylate, the plasma level of salicylic acid decreases as anticipated (Fig. 1). THE EFFECT or INCREASING THE CONCENTRATION OF METHYL SALICYL- ATE ON ITS PERCUTANEOUS ABSORPTION Figure 2 shows a family of curves corresponding to the increase in plasma salicylic acid following the topical administration of various concen- n 60 4o • 2o o 100% I ' 20 % I _ I0% 5% - . z.5O/o Ig.•--.-'-- ' I I I 5 I0 30 I 2 3 (MIN.) TIME (HOURS) Fig. 2.--Effect of varying concentration on the absorption of methyl salicylate in mineral oil.

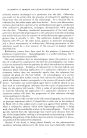
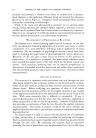
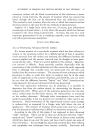
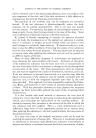
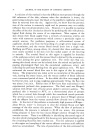
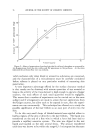
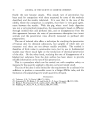
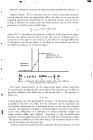
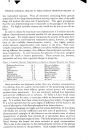
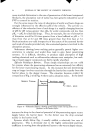
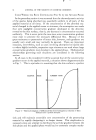
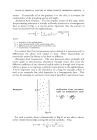
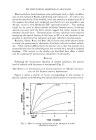
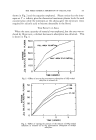
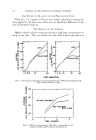
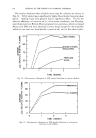
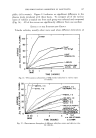
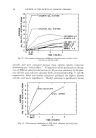
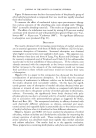
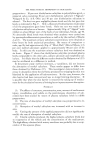
100 JOURNAL OF THE SOCIETY OF COSMETIC CHEMISTS trations of methyl salicylate in mineral oil. Figure 3 gives similar curves showing the plasma levels of unhydrolyzed methyl salicylate and serves to demonstrate the relationship between plasma levels of methyl salicylate and salicylic acid. Figure 4 shows a logarithmic transformation of the data _ IOO% 20% - -- IO% i// ........•-___ • 5% .... , , 5 1530 I 2 3 (MIN.) TIME (HOURS) Fig. 3--Effect of varying concentration on the absorption of methyl salicylate in mineral oil. I I I I I I ! I I 70 -- /100% j200/. - 50-- - 40 20 I0 -/ ./.-'q I I • I" I I I - c7' O• :• • 1.10 1.201 .:30 1.40.50 .601 20 .eo I I I I I .08 .16 22 .:39 .6:3 5 I0 15 :30 I HR. MIN. TIME GENERAL E(3UATION: A= KS + (C-K) S= I-e -t A ß ABSORPTION ).Lcj/mi. K ß SLOPE CßVALUEOFAWHEN SßO Fig. 4.--Effect of varying concentration on the absorption of methyl salicylate in mineral oil transformed to linear form. 1.90 I 1.0• I I S .86 .95
Purchased for the exclusive use of nofirst nolast (unknown)
From: SCC Media Library & Resource Center (library.scconline.org)