QUANTITATIVE MICROSCOPY 489 orate techniques employed by those who in the patent literature are so aptly described as "skilled in the arts." MICROSPECTROPHOTOMETRY Spectrophotometry plays an important role in almost every aspect of chemical research. When the specimen has microscopic dimensions, the sample compartment of a standard spectrophotometer may be replaced by a microscope and the sample cell by the microscope slide. Such in- struments are called microspectrophotometers. They have found wide- spread application in histochemistry, where minute amounts of substances are traced by their absorption, or where microchemical tests can be carried out even within individual cell components by means of color reactions. Microspectrophotometers permit identification of substances by means of their spectral absorption characteristics. Determinations of concentra- tions of the relative and sometimes even of the absolute amount of chemical compounds are possible. Sensitive microspectrophotometers have meas- uring areas as small as 1 X 1 /•. There are also microspectrophotometers for measurements in the ultraviolet spectral range (1,2). An estimate of the sensitivity of these methods leads to the following values. It can be assumed that a minimum absorption of 5% is sufficiently high above the noise level to exclude statistical errors. It shall further- more be assumed that the specimen has a geometric thickness of 10u and that the molecular coefficient of extinction at the maximum of the extinction curve has a value of 15,000 cm.2/mMole. This is an average value. Dyes very often have molecular coefficients of extinction as high as 35,000 cm.•'/mMole, whereas substances of a simpler structure such as trypto- phane have coefficients of around 8000 cm.=/mMole. The concentration can be calculated from the formula, ] = [:•lO-•cd in which I is the transmitted intensity, I0 the incident intensity, d stands for the geometric thickness of the specimen expressed in centimeters, c is the concentration expressed in Mole/10acm. a, and e is the molecular coeffi- cient of extinction, which has the dimension cm.=mMole. Rearranging leads to 1 ,r0 •d log f = o The minimum detectable concentration, using the values given above, would then be 1 100 Mole 15,000 X 10 X l0 -4 log • = 1.2 X 10 -a X 10 a cm Assuming a measuring area of 4 X 4u and a section thickness of 10/•, the

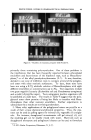
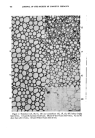
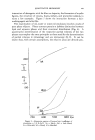
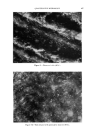
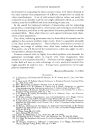
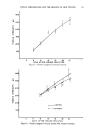
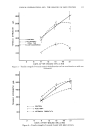
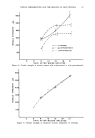
490 JOURNAL OF THE SOCIETY OF COSMETIC CHEMISTS measured volume would be 160/z a. The minimum measurable amount of absorbing substance in this volume then is approximately 2 X 10 -•ø Mole. With a molecular weight of around 250, which again is an average value for a typical dye molecule, this sets the minimum detectable amount of such a dye at 5 X 10 -•4 g. Certain precautions have to be taken. For instance, it is advisable to use an unstained but otherwise identical specimen to measure I0, in order to compensate for light losses due to light scattering. If the absorbing material is not distributed homogeneously but in the form of granules, one has to use the two-wavelength method (3). Microspectrophotometry has a number of applications in the cosmetic industry, especially so in histochemical work or in penetration studies. Some materials reveal more information in reflected light than through their absorption spectrum, as shown in Figs. 3 and 4. Figure 3 shows the absorption spectrum of human hair, covering the range from bleached, almost white hair to dark black. The absorption spectra in the visible range are not very informative. Figure 4, however, shows the spectral reflectivity. The technique is the same, in principle, as that employed in transmitted light, but the condenser of the microscope is replaced with a vertical illuminator. Since hair is highly birefringent, the same precau- tions have to be employed that are also taken in measurements of the re- flectivity of ores and minerals (4, 5). Similarly, not only the relative spectral reflectivity can be measured, but also, in suitable cases, changes in reflectivity, e.g., after treatment of hair with cosmetic preparations. Again, once a measurable parameter is found, valid comparisons become possible. PHASE {•JONTRAST MICROSCOPY Many specimens, however, do not contain light absorbing structures. Their detail consists of structures with a refractive index different from that of their surroundings. In a normal brightfield microscope, such structures do not appear with any appreciable contrast. Such phase de- tail can be made visible by phase contrast (6, 7). Differences in optical path are by this process converted into differences of light intensity. Inherent in the process, however, is the occurrence of light or dark seams wherever steep gradients of refractive index occur. These artifacts are called halos, and due to their presence the intensity distribution of a phase contrast image cannot be used to determine quanti- tatively the optical path differences in the specimen. For qualitative observation, however, phase contrast is ideal in the study of pure phase objects, in the examination of washing agents, the
Purchased for the exclusive use of nofirst nolast (unknown)
From: SCC Media Library & Resource Center (library.scconline.org)