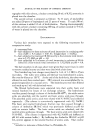
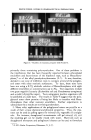
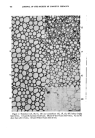
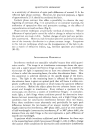
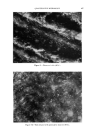
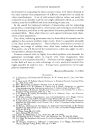
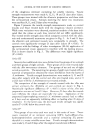
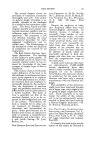
QUANTITATIVE MICROSCOPY 499 Figure 11.--Interferegram of untreated skin (200X). [igure I2.--Interfemgram of skin treated with proteolytic enzyme (200X).

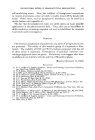
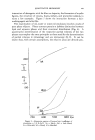
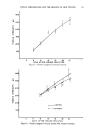
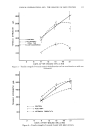
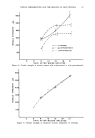
500 JOURNAL OF THE SOCIETY OF COSMETIC CHEMISTS impossible. It is then advisable to use the continuous scale method (21). The replica is mounted in a cell with two plane parallel plates, which is filled with a liquid of a known refractive index. The closer the refractive index comes to the index of the replica material, the more the scale can be expanded. This point can be illustrated by the following numerical ex- ample: If the path difference is 100 orders, i.e., 100 X 550 m•, such a fringe displacement should be seen in the interferogram if the replica has a re- fractive index of 1.5 and if one measures against air (n = 1.0), then t must be 110,000 m•. The same profile depth of 110,000 m• in a replica of re- fractive index 1.5, when measured against oil of 1.4:9 refractive index, would produce a path difference of only 110,000 X 0.01 or 1100 m•. Since a fringe shift of 100 orders in air is too high for positive tinge identification, the Zehender cell can be filled with a liquid of a refractive index of 1.49, thus lowering the fringe shift from 100 to 2 orders. Using the previous numerical example it can be seen that 55,000 m• = 100 orders and that 1100 m• = 2 orders. Another application of interference methods is the determination of the depth of indentations made by a micro hardness tester (Fig. 14). Such tests are of interest, e.g., to establish the hardness of nail polish. Even very low loads on the Vickers diamond are occasionally too high for such relatively soft materials, and scratch tests seem to be more promising. The depth of a regular Vickers indentation can easily be determined by a measurement of the length of its two diagonals (22). In scratch hard- ness tests, the scratch depth is proportional to the width of the scratch, which can be measured directly. A more accurate and direct measurement of the scratch depth is possible by means of determination of the fringe displacement in an interference microscope. Distance from starting point • Figure 13.--Tracing of interference fringe (A and B = profiles of enzyme-treated skin C = profile of untreated skin).
Purchased for the exclusive use of nofirst nolast (unknown)
From: SCC Media Library & Resource Center (library.scconline.org)