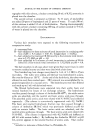
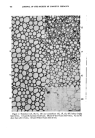
QUANTITATIVE MICROSCOPY 495 to a sensitivity of detection of optic path differences of around 15 A. for reflected light phase contrast. However, for practical purposes, a figure of approximately 25 A. should be considered the limit. Incident phase contrast thus offers a possibility to observe the very beginning of corrosion (Fig. 7) in containers or on container material, the uniformity of sprayed-on films and protective coatings, or the effect of coarse abrasives on tooth surfaces (Fig. 8). Phase contrast techniques are primarily methods of detection. Minute differences of optical paths caused by relief or change in refractive index in the specimen are made visible. Sudden changes of optic path are particu- larly accentuated. However, halo formation prevents quantitative evalua- tion of the intensity distribution in a phase contrast image. Exceptions to this rule are techniques which use the disappearance of the halo to de- tect a match of refractive indices, e.g., between specimen and medium (10-12). INTERFERENCEMICROSCOPY Interference methods are especially valuable tiecause they yield quanti- tative results. The image in an interference microscope shows the speci- men and a superiraposed interference fringe system. In any interference microscope the light is separated into at least two coherent beams. One of these is called the measuring beam, the other the reference beam. How this separation is achieved depends on the specific design of the instru- ment. The light in the measuring beam is affected by the specimen the reference beam is given an optical path that will leave it either com- pletely unaffected by the specimen or which keeps the specimen influence at a minimum. Behind the object plane the two coherent beams are re- united and brought to interference. Even without a specimen in the microscope, one observes a system of interference fringes: in monochro- matic light, a dark fringe where conditions prevail for destructive inter- ference between measuring and reference beam, and a bright fringe where conditions exist for constructive interference between these two beams. Since these conditions occur alternately and periodically for optic path differences between the two beams of an uneven number of half-wave- lengths (destructive interference, 180 ø phase shift), and of an even number of half-wavelengths (constructive interference, 0 ø or 360 ø phase shift), the distance from one dark fringe to the next represents a path difference of exactly one wavelength. A specimen which introduces additional path differences for these rays in the measuring beam which have passed through it, will, in effect, change the location where conditions for destructive and constructive interference

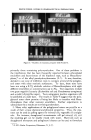
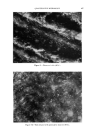
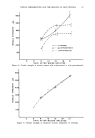
496 JOURNAL OF THE SOCIETY OF COSMETIC CHEMISTS occur in the fringe system. An axially existing optic path difference, there- fore, leads to a lateral fringe displacement or fringe shift. The amount of this lateral displacement is directly proportional to the optic path dif- ference introduced by the specimen and can be compared directly to the one-wavelength units of optic path difference given by the distances from fringe to fringe in the undisturbed part of the field of view (13-15). Suit- able instrument controls permit variation of the distance between the interference fringes. This does not, of course, change the existing path difference between them, i.e., one wavelength. The akiustment rather cor- responds to a scale expansion, and the sensitivity of detection is directly proportional to the fringe width. In the most sensitivc setting only one fringe covers the whole field of view. This condition is called homogeneous field or interference contrast. Optic path differences introduced by a speci- men then appear as changes of image intensity, which again are a quantita- tive measure for the phase shift introduced by the specimen. Measurements are taken with compensators, which are calibrated di- rectly in m• optic path and which permit an exact measurement of the lateral fringe displacement, or a photomicrograph is taken and the density recorded in a microdensitometer. At this point it may be well to ask what kind of information the cosmetic chemist can obtain from micro-interferometric methods. Such informa- tion falls into two categories. First, there are the directly measurable data: Measurements of optic path. Measurements of refractive index. Measurements of dispersion. Measurements of geometric thickness. Simultaneous measurement of thickness and refractive index. Determination of total dry mass of an object. Determination of total wet mass of an object. Measurement of mass per unit area in the specimen. Concentration of substances in the specimen. Volume of specimen structures. Second, there are the indirect data which follow from the interpretation of the directly measured values and for which only a few examples can be given here. Measurements of geometric thickness may be used to de- termine the thickness and uniformity of sprayed-on films, swelling effects and behavior of materials, or to measure the depths of scratches caused by polishing agents. A practical example is profile measurements, here ap- plied to a determination of skin smoothness (16, 17). This can be carried out as a nondestructive test by taking a replica of the surface using trans- parent replication materials. Figures 9 and 10 show photomicrographs of skin surfaces, one untreated
Purchased for the exclusive use of nofirst nolast (unknown)
From: SCC Media Library & Resource Center (library.scconline.org)