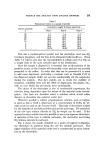
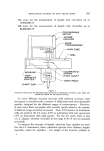
RHEOLOGICAL STUDIES OF NEW CREAM BASES 223 In the case of the smallest spindle, e.g. spindle F, the scale reading in a measurement at 1 rpm will be 20% greater after the spindle has made one revolution since it will at the same time have sunk 14 mm further into the material under investigation. The method suggested here makes use of the possibility of performing the measurements at different rates of shear by varying the speed of rotation. It agrees in its principal features with the methods which are usually used for the recording of rheograms for plastic, thixotropic materials and which have been described, for example, by Green (2). The measurement of the shearing stress is first performed at progress- ively increasing rates of shear (up-curve) and thereafter at progressively decreasing rates of shear (down-curve). The possibility of performing measurements of this type is hinted at in Brooktieid's brochure "Solutions to sticky problems," but no details are given to indicate how the measurements should be performed or how the results should be inter- preted. To use this method, it is necessary to have access to an eight- speed viscometer. Because of its low spring tensions (G ---- 674 dyne. cm), the LVT model can only be used to examine relatively soft creams at a temperature of 20øC. With the RVT (G = 7190 dyne. cm) model, measurements can be made on almost all of the existing pharmaceutical and cosmetic ointments and creams, etc. Very firm products, e.g. zinc oxide pastes and wool fat, must be tested on the HBT (G = 57500 dyne-cm) model. THE FRYKL•SF METHOD OF MEASUREMENT 1. The scale must be in such a position that the zero line can only just be seen on the right-hand side of the scale (which rotates from the right to the left). The spindle is immersed so that the crosspiece is 10 mm under the surface of the test material (the shaft of the spindle will then be 16 mm below the surface). 2. The viscometer is started at the lowest speed (0.5 rpm for RV). 3. The largest deflection of the pointer is read off. This is obtained while the spindle is still stationary. 4. The speed is increased to the next speed of measurement. The reading is taken after 60 sec. 5. The measurements are continued, as described under 4, using successively increasing speeds. 6. At the maximum rotation speed, a reading is taken after 60 sec

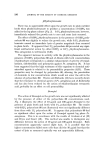
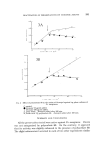
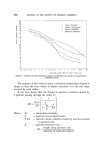
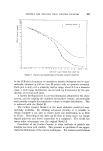
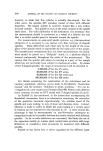
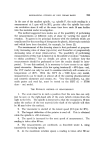
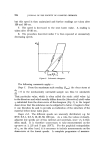
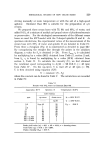
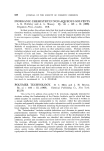
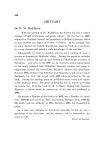
224 JOURNAL OF THE SOCIETY OF COSMETIC CHEMISTS but this speed is then maintained and further readings are taken after 120 and 180 sec. 7. The speed is decreased to the next lower value. A reading is taken after 15-20 sec. 8. The procedure described under 7 is then repeated at successively decreasing speeds. Figu•'e 2 Schematic rheogram. The following comments apply:- Stage 3. From the maximum scale reading (Smax) , the shear stress at d7--0 in the mechanically untreated sample can thus be calculated. dt That particular value, which is often called the static yield value in the literature and which usually differs from the (theoretical) yield value ß f calculated from the down-curve of the rheogram (Fig. 2), is the largest shear stress that the substance can be subjected to before it begins to flow it can therefore be said to provide an indication of the structure of the material before shear takes place. Stages 4-8. The different speeds are unevenly distributed, e.g. for RVT, 0.5, 1, 2.5, 5, 10, 20, 50, 100 rpm. As a rule, the values at closely- adjacent low speeds are of less interest and uncertain, since z/zf is then often small. It is therefore unnecessary to take measurements on the up-curve at 1, 2.5 and 5 rpm (RVT). For the graphical extrapolation of zf, on the other hand, it is necessary to include measurements on the down-curve at the lowest speeds. A complete programme of measure-
Purchased for the exclusive use of nofirst nolast (unknown)
From: SCC Media Library & Resource Center (library.scconline.org)