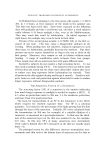
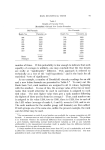
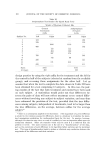
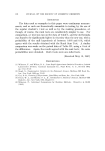
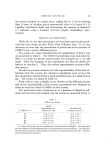
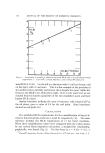
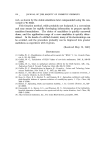
EASY STATISTICAL TESTS Table I Results of Viscosity Tests (Brookfield) Old and New Lotion Formulas 97 Old Formula New Formula Batch No. Viscosity, cp Batch No. Viscosity, cp 364 1558 723 1560 382 1600 740 1423 401 1423 796 1300 465 1842 843 1600 489 1761 975 1329 503 1602 989 1590 510 1657 994 1423 999 1298 Sums 11443 11523 Averages 1635 1440 number of times. If this probability is low enough to indicate that such equality of averages is unlikely, one may conclude that the two means are really or "significantly" different. This approach is referred to technically as a test of the "null hypothesis," and is the basis for all statistical "tests of significance." As an example, a number of Brookfield viscosity readings for an old and a new lotion formula are presented in Table I.* To carry out the Rank Sum Test, rank numbers are assigned to all 15 values, beginning with the smallest. In case of ties, the average value of the two or more ranks that would otherwise be used in succession is assigned to each tied value. The next higher value then gets a rank number following the highest of those used to form the average. t Thus, rank number one is assigned to the value 1298, two to 1300, three to 1329, five to each of the 1423 values (average of ranks 4, 5 and 6), seven to 1558, and so on. The rank numbers for the smaller group (old formula) are then added. If both groups are of the same size, unlike the present example, the rank sum for either may be used. * One measurement on each of seven batches was available for a group comprising an old formula. A measurement on each of eight was obtained for a new for•nula. The problem is to determine whether the numerical difference from measurement to measurement for a given formula, representing normal batch-to-batch variation as well as any variation attributable to the measurement procedure itself, is smaller than the difference between the averages of the two sets of measurements. t A large number of ties among the data (more than 10% or so) is undesirable, as it tends to affect the correctness of the probability value obtained at the end of the test. The true probability in such a case will be smaller than that found.

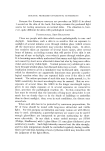
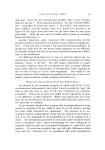
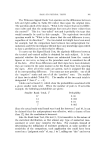
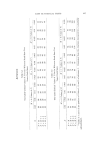
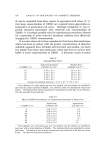
98 JOURNAL OF THE SOCIETY OF COSMETIC CHEMISTS Table Ii Ranking o[ Viscosity Test Data Old Formula New Formula Value Rank Value Rank 1558 7 1560 8 1600 10.5 1423 5 1423 5 1300 2 1842 15 1600 10.5 1761 14 1329 3 1602 12 1590 9 1657 13 1423 5 1298 I Rank totals 76.5 43.5 T = 76.5 = sum of ranks in smaller sample. Table II shows the data of Table I after completion of these steps. For clarity, both columns of ranks have been added. The number of items in the smaller group is seven, and this is called M. That in the larger is M q- 1 or eight, and this is referred to as N. The rank number, T, for the 3/items is 76.5. The three numbers M, N, and T are used to locate critical values in Table A (see Appendix). Table A-1 gives lower critical values of T of 41, 39, 36 and 34, for the four probabilities 0.05, 0.025, 0.01 and 0.005, while Table A-2 gives upper critical values of 71, 73, 76 and 78 for the same probabilities. In order to claim "significance" for the difference between the two averages, the calculated value of T must either exceed one of the upper critical values or be less than one of the lower values (in the case of equal sample sizes, these criteria may be applied to either of the two rank totals). In the present case, the calculated value is 76.5, which lies between 76 and 78 in Table A-2, and is therefore associated with a probability between 0.01 and 0.005. The investigator therefore concludes that the likelihood of obtaining a total this large by chance (if the two formulas really have the same viscosity and the observed difference is due simply to sampling and experimental variation) lies between 0.5 and 1%. This represents a fairly low probability, and he would probably be more willing to accept the interpretation that a real difference exists than that such an unlikely chance event occurred. There is a technicality applying to this conclusion, connected with the use of the words "one-tailed" in the titles for Tables A-1 and A-2. In the example, it was assumed that the question being asked of the
Purchased for the exclusive use of nofirst nolast (unknown)
From: SCC Media Library & Resource Center (library.scconline.org)