EASY STATISTICAL TESTS 99 data was, "Does the new formula give product with a lower viscosity than the old one ?" If the question had been, "Are the viscosities differ- ent?" (regardless of which was lower), a "two-tailed" test would have been required, and the tabular value of T would have needed to be higher for the upper limit and lower for the lower limit for any given probability. Both the one- and two-tailed tables appear in expanded form in the literature (1). Another important point connected with interpretation of this example should be mentioned, and applies to most statistical significance tests. If the user fails to obtain a low and convincing probability, he should not claim that the two means being compared are not different, but should conclude only that he has been unable to demonstrate a differ- ence to his satisfaction. The Wilcoxon Rank Sum Test (1) may be used for almost any nu- merical data, whether they are viscosities, weights, percentages or ratios, arbitrary scores, or the like. The only major requirement to assure reasonable validity is that the investigator be able to assume without much doubt that the experimental or measurement errors applying to the two sets of data are of the same magnitude. This would be the normal situation if all conditions surrounding the two sets of tests were similar (same technician, similar sampling procedures, etc.). WILCOXON SIGNED-RANK TEST FOR PAIRED DATA In contrast to the foregoing example, in which each of the 15 ob- servationswere independent of each other, it maybe possible to "pair" the data so that the tests in each of the two treatments are somehow associated. If this can be done, the ability of the experiment to show a real difference is often enhanced. When such paired data are avail- able, the test described for the first section is still valid, but a more sensi- tive procedure is available. As an example of paired data, suppose that an antiperspirant is being tested by applying it to one axilla of each of several subjects, leaving the other axilla untreated for comparison. The question to be an- swered is whether antiperspirant action may be claimed for the product, and, if so, the magnitude of the probability of error in making such a claim. The perspiration generated in each axilla under standard condi- tions is measured, and a figure representing the total milligrams of moisture found in each case is obtained (treatment vs. control for each subject). To avoid any possible bias, any left-right differences which may exist are "balanced out" in accordance with good experimental

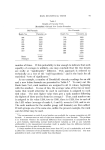
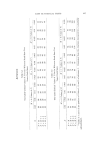
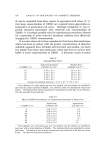
100 JOURNAL OF THE SOCIETY OF COSMETIC CHEMISTS Table III Antiperspirant Test Results (for Signed Rank Test) VCeight of Moisture Collected, Mg. Control Antiperspirant (Untreated) (Treated) Axilla Axilla Subject No. Left Right Left Right 1 251 ...... 201 2 258 ...... 150 3 ... 1006 1116 ... 4 669 ...... 702 5 ... 150 131 ... 6 ... 484 350 ... 7 ... 397 274 ... 8 783 ...... 503 9 ... 142 99 ... 10 380 ...... 151 11 ... 721 613 ... 12 522 ...... 411 Sums 5763 4701 Averages 480 390 design practice by using the right axilla for the treatment and the left for the control in half of the subjects (selected at random from the available group), and reversing these assignments for the other half. Let us assume that when the test is complete the data shown in Table III have been obtained for a test comprising 12 subjects. In this case, the pair- ing consists of the fact that both treatment and control have been used on each subject. A statistician would point out that differences be- tween the pairs of data will now reflect treatment versus control differ- ences without involving any subject-to-subject variation, and may thus have enhanced the precision of the test, provided that the true differ- ences among subjects, independent of treatments, tend to be larger than the true differences, on the average, between axillae for the average subject.* * There is an assumption implicit in this statmnent: if the magnitude of a given difference is •elated to the variation among the differences, there is a tendency to invalidate the statis- tical assumptions underlying the mathematical basis for the test. In practice, however, although this situation may exist, as a rule it is unlikely to have an important effect upon the conclusions obtained. There are remedies which may be used if it is believed that the problem is severe. The most common one is the use of a "transformation" of the data, such as the conversion of each difference to its logarithm before carrying out the statistical test. This type of transformation tends to reduce or eliminate any correlation between the magnitudes of the differences and their variation.
Purchased for the exclusive use of nofirst nolast (unknown)
From: SCC Media Library & Resource Center (library.scconline.org)