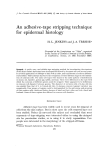
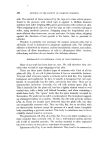
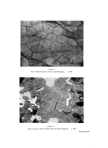
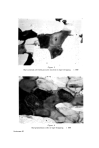
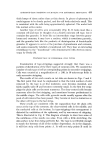
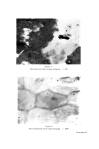
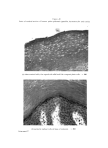
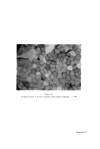
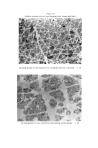
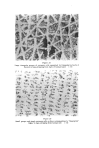
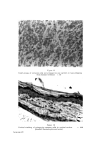
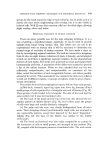
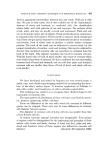
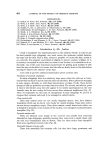
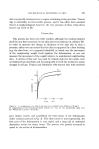
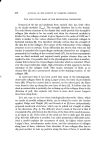
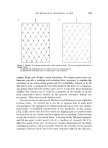
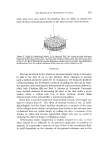
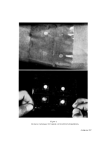
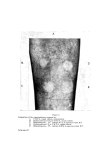
ADHESIVE-TAPE STRIPPING TECHNIQUE FOR EPIDERMAL HISTOLOGY 459 species by the band round the edge of each cell (Fig. 11). It looks as if it is merely the zone where neighbouring cells overlap, but it is also visible in isolated cells. Wolf (2) says that corneum cells have bevelled edges, allowing slight overlap, above and below. REGIONAL VARIATION IN HUMAN CORNEUM There are many possible uses for the tape stripping technique. It is a way of getting a superficial biopsy, painlessly. It can be used to provide samples from intact living human skin. But before one can use it for experimental work on human skin it will be necessary to determine the normal range of variation of human corneum. We have made a start on this by investigating regional variation. We took six consecutive strippings from 14 sites on eight human volunteers (4 male, 4 female), and attempted to find out (a) if there is significant regional variation, (b) the characteristic features of each region. The strips were processed as usual, and stained with haematoxylin and eosin. A proportion of the slides were scanned to provide a list of the salient features. When we were satisfied that our list was sufficiently comprehensive, and comprehensible, we examined all the slides, noted the incidence of each recognizable feature, and where possible estimated its extent. When assessment was complete the data were collated to find out if different regions, or groups of regions, could be given charac- teristic descriptions. The results showed that topographical regions fell into four main groups: (a) Mid-back, stomach, upper leg, upper arm, lower leg, forearm, all had small groups of cells separated by a triangular network of fissures (Fig. 12). These groups of cells tended to be triangular. The side of the neck had the same pattern but it also had nucleated cells. (b) The back of the hand and the top of the foot also showed the tri- angular pattern of shallow fissures (Fig. 18), but in these areas the groups of cells were large and usually distinctly triangular. (c) The palm and sole were very clearly distinguished from all other areas. Their strippings showed predominantly single cells, not arranged in any appreciable pattern, except that imposed by the local "fingerprint" ridging (Fig. l•t). The base of the thumb was similar to the middle of the palm. (d) The cheek and forehead were also easily recognisable as a group by the occurrence of cells in small groups, not arranged in any pattern (Fig. 15), coupled with the frequent presence of nucleated cells. The neck resem-

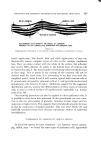
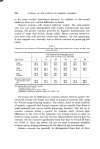
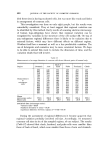
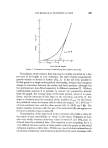
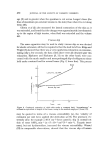
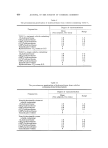
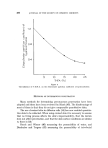
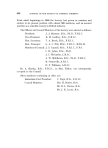
460 JOURNAL OF THE SOCIETY OF COSMETIC CHEMISTS bled these sites in having nucleated cells, but was more like trunk and limbs in arrangement of corneum cells. This investigation was done on only eight people, but the results were remarkably consistent. They at least suggest that regional variation can be identified by this method. Early results of scanning electron microscopy of human tape-strippings have shown that regional variation can be recognised by variation in the structure of the cell surface (9). On top of any endogenous regional differences there is likely to be variation due to external factors, which may have different effects on different regions. Weather itself has a seasonal as well as a less predictable variation. The use of detergents and cosmetics may be more consistent factors. We hope to be able to extend this work to include the dimension of time, and the variation which that will involve. Table I[ Measurements of average diameter of corneum cells from different parts of human body. Back of Region Stomach Arm hand Palm Forehead Cheek -- 622 640 570 495 473 427 692 696 572 525 550 445 716 704 580 566 556 463 725 713 595 567 566 510 737 732 612 576 573 519 Measurements 740 741 657 594 586 560 in 749 743 690 600 592 580 microscope 807 799 697 610 607 588 units 833 800 698 614 610 595 836 801 749 619 626 608 843 815 759 632 653 618 862 827 760 640 660 636 869 835 783 657 687 640 884 909 839 663 751 646 Means (microscope units) 779.6 768.2 682.6 597.0 606.4 559.6 Means(•m) 34.3 33.7 29.9 26.2 26.6 24.6 Statistical data (microscope units): Variance ratio----23.27 Standard deviation of mean= 19.28 Significant difference between regions (P= 0.05) ---- 45.46 During the assessment of regional differences it became apparent that regional variation probably involved cell size. Accordingly, we measured corneum cell sizes in six of the sampled regions, of one subject. The results (Table II) showed that cheek, forehead, and palm cells were smaller than those of back of hand, which were smaller than those of arm and stomach.
Purchased for the exclusive use of nofirst nolast (unknown)
From: SCC Media Library & Resource Center (library.scconline.org)