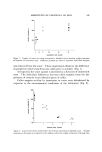
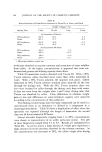
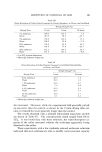
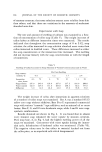
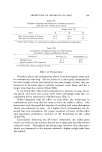
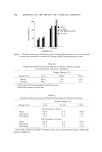
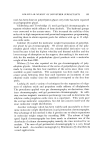
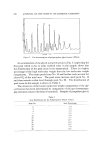
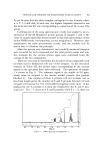
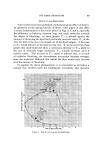
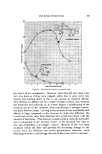
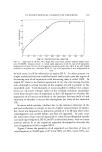
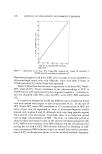
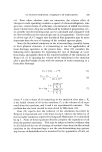
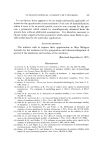
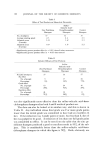
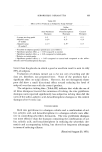
146 JOURNAL OF THE SOCIETY OF COSMETIC CHEMISTS of stratum corneum that some solutions extract more solubles from skin than others and that there are variations in the amounts ot5 surfactant absorbed onto skin. Experiments with Soap The rate and amount of swelling of calluses was examined as a func- tion of concentration of toilet soap (Table V). The weight increases of callus halves at different immersion times were measured. The results indicated that throughout the concentration range of 0 to 2.4% soap solution, the callus immersed in soap solution absorbed more water than callus immersed in distilled water. These differences increased as either the soap concentration or the immersion time increased. The swelling did not increase linearly with the soap concentration or with the length of immersion. Table V Swelling of Callus Immersed in Soap Solutions of Various Concentrations and in Water Per Cent Swelling Soap concen- trations, % 0.6 1.2 1.7 2.4 Immersion 4.5 70 4 70 21 1.5 23 time, hours Soap solution 137.0 245.0 135.0 267.0 257.5 116.0 208.0 Water control 132.0 229.0 111.0 203.0 208.5 82.2 177.0 Difference 5.0 16.0 24.0 64.0 49.0 33.8 31.0 The weight increase of callus after immersion in aqueous solutions of a number of toilet soaps was examined. Bar A was a standard 85/15 tallow coco soap without additives Bars B to E represented commercial soaps with various "cosmetic"-type additives, such as mineral oil or cocoa butter Bars F, G, and H were deodorant soaps, while I and K were soap- synthetic combinations. Results obtained are shown in Fig. 4. It was found that in almost every instance soap enhanced the water uptake by stratum corneum. Pure soap base, A, in Fig. 4, had the highest swelling power of all the soaps we examined. Concurrent with water uptake during the immer- sion cycle, dehydration of hydrated callus was monitored (Table VI). The negative values may be due either to material leached out from the callus piece, or to superficial cells which desquamated.

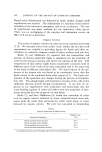
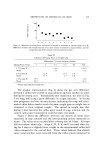
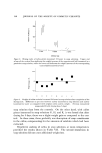
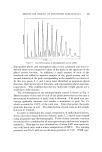
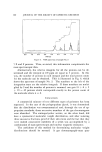
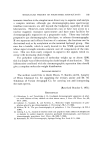
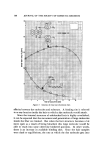
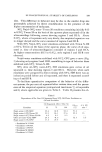
ABSORPTION OF CHEMICALS ON SKIN 147 200- lOO ß ß ß ß ß ß [] ß A B C D E F G H I K Figure 4. Behavior of callus pieces immersed 21 hours in solutions of various soaps A to K. Difference between the weight increase of a callus moiety immersed in soap solution and the weight increase of the control moiety immersed in water Table VI Influence of Drying Time on Weight Loss Differences (%) from Original Weights Drying Time, Hours 1 3 4.5 5.5 48 120 1.7% soap E --4.6 --12.2 Water 3.3 --7.2 2.5% soap E 15.8 11.6 3.8 Water 14.7 6.7 0.8 2.4% soap H 78.3 --8.8 Water 23.9 -- 10.4 Minus sign indicates weight loss. The graphic representation (Fig. 5) shows the per cent difference between a callus half swollen in soap solution and one swollen in water during the drying cycle. Immediately after immersion, the lines in Fig. 5 are long, indicating a great difference in weight increases. As drying time progresses, the lines become shorter, indicating that soap and water- soaked callus halves tend to reach the same weight gain or weight loss as compared to their original weight. The spread in weight loss after drying 5 days between the callus piece tested in soap solution and the control callus piece immersed in water becomes very small. Figure 6 shows the difference between one moiety of callus piece immersed in soap solution and the corresponding moiety immersed in water. The values were recorded after a drying ti•ne of 5 days. All soaps did not behave identically: Soaps C, D, E, F, and I reverted after dry- ing for 5 days to a slightly lower weight in the experimental callus half when compared to the control half. These values indicate that slightly more water-solubles were extracted from the callus pieces immersed in
Purchased for the exclusive use of nofirst nolast (unknown)
From: SCC Media Library & Resource Center (library.scconline.org)