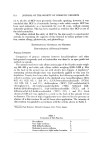
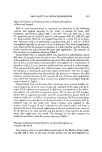
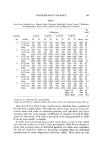
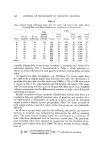
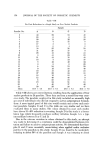
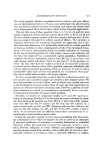
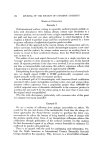
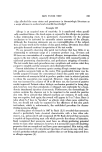
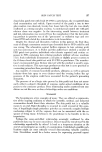
ANTIPERSPIRANT EFFICACY 141 Table I Data oerom Panelists in a Recent Study Showing Individual Control Sweat Collections, Sweating Ratios, Mean Values, and Per Cent Coefficient of Variations Panelist No. % Collections Coeff. 1/8/73 1/10/73 1/12/73 1/15/73 Axilla B C B C B C B C Mean Var. 1 R(T),mg 547 L (C), mg 319 Ratio 1.714 2 R (T), mg 606 L (C),mg 544 Ratio 1.113 3 R (T), mg 1027 L (C), mg 1180 Ratio 0.870 4 R (T), mg 376 L (C),mg 454 Ratio 0.828 5 L(T),mg 748 a R (C), mg 6'81 Ratio 1.098 6 R (T), mg 958 a L (C),mg 1726 Ratio 0.555 7 L (T), mg 536 R (C), mg 569 Ratio 0.942 808 613 735 493 433 530 1.638 1.415 1.386 514 92 b 330 463 116 377 1.110 0.793 0.875 1143 927 1085 1282 1057 1127 0.891 0.877 0.962 408 380 295 363 491 388 1.123 0.773 0.760 1254 1087 1042 1111 895 829 1.128 1.214 1.256 260 a 432 819 488 696 1391 0.532 0.620 0.588 479 552 501 519 548 622 0.922 1.007 0.805 606 1020 a 510a 730 696 22 435 704 433 561 488 22 1.393 1.448 1.177 1.301 1.434 11 469 710 a 269 a 567 489 28 408 616 216 375 424 27 1.149 1.152 1.245 1.512 1.163 14 1310 a 1247 840 a 1095 1084 13 1353 1357 968 1199 1190 11 0.968 0.918 0.867 0.913 0.908 3.4 511 a 491 263 a 372 387 21 522 500 302 401 428 17 0.97'8 0.982 0.870 0.927 0.905 12 1411a 927 938 810 1027 20 1350 737 776 606 873 26 1.045 1.257 1.208 1.336 1.192 8.3 685 352 499 581 573 39 1038 574 836 1059 976 40 0.659 0.613 0.596 0.548 0.588 9.1 594 a 540 407 a 439 506 11 637 620 398 520 554 13 0.932 0.870 1.022 0.844 0.918 7.6 Mean (T) 680 22 Mean (C) 705 22 Mean Ratio 1.015 9.3 Extremes in collections for each panelist. Data not used due to marked vari,ation from other values and collections below 100 mg. Data presented in Table I show control sweat collections from a portion of the data from a typical study. This table also shows mean values for sweat col- lections from each axilla of individual panelists and individual and mean sweating ratios for each panelist. Coefficients of variation of each of these means are also shown. This table is presented so the data presented in Table II can be more readily evaluated. In Table II are presented mean control values from a series of tests which were derived as shown in Table I. Data presented in Table II very clearly in- dicate that sweating ratios of individual panelists are much more reproduci- ble and are much less subject to day-to-day variations than are individual measurements of sweat output from individual axillae. These ratios are also

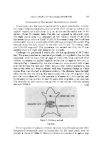
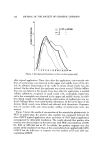
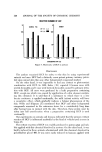
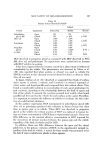
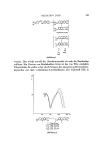
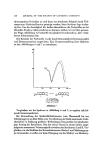
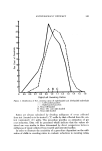
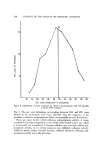
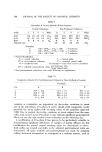
142 JOURNAL OF THE SOCIETY OF COSMETIC CHEMISTS Table II Mean Control Sweat Collections from Test (T) Axilla and Control (C) Axilla (Mean Sweating Ratios and Mean Coefficient of Variations for 8 Recent Tests) Axilla Time Spread Coef. Coef. Coef. No. of No. of of Detns of V,ar. of Var. Ratio of Var. Study Panelists Collections (Weeks) T(mg) (%) C(mg) (%) T/C (%) A 24 16 10 434 43 451 42 0.991 15 B 12 8 4 433 24 429 25 1.001 11 C 12 8 4 573 27 622 25 0.958 12 D 12 12 7 584 26 604 25 0.999 11 E 12 12 7 567 26 577 25 0.991 12 F 24 8 10 536 30 568 32 0.972 17 G 12 28 19 542 29 633 26 0.850 18 H 12 28 19 618 31 593 33 1.020 17 Mean 523 31 552 30 0.974 15 virtually independent of day-to-day variations in sweating rates observed in individual panelists. This is demonstrated in Table I, which indicates ex- tremes in sweat collections for each panelist and their corresponding sweating ratios. As reported by other investigators, e.g., Wooding (8), sweat output from the right axilla is slightly higher than from the left axilla. The distribution of panelists showing right-over-left ratios from 0.500 to 1.750 at 0.100 increments is shown in Fig. i for right-handed and left-handed individuals. The mean ratio for each group and the mean of all panelists determined from weighted values to compensate for the differences in numbers of right- and left-handed individuals are shown. Results of analysis of these randomly selected data indicate that there is a correlation between right-left sweating rates of panelists and whether they are right-handed or left-handed. As many of us have assumed, the dominant armpit produces slightly greater perspiration. There are many reversals in both groups and the mean R/L ratios of the two groups are not statistically different. In all cases, except where noted in the following discussions, per cent re- ductions in sweating were evaluated by determining the shift in sweating ratios. The mean control sweating ratios were determined in a minimum of eight collections distributed over at least four control days. The post-treat- ment sweating ratios were adjusted to compensate for the deviation of in- dividual mean control ratios from 1.000. The basic formula for these calcula- tions is: 1.000 - post-treatment ratio) 100 = % reduction in sweating mean control ratio
Purchased for the exclusive use of nofirst nolast (unknown)
From: SCC Media Library & Resource Center (library.scconline.org)