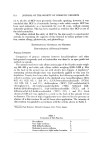
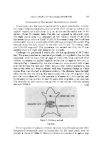
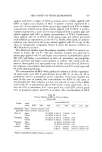
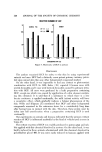
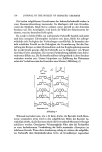
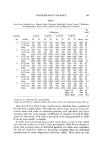
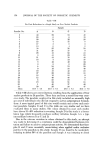
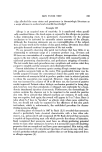
ANTIPERSPIRANT EFFICACY 149 with Samples A and B to T and U, as shown in the above format, so ratios are calculated A/B for all panelists during control and post-treatment peri- ods. While this procedure is very sensitive in showing differences in antiper- spirant activity, which is its primary purpose, estimations of reductions of both samples can be also made by applying Procedure A to the data. PROCEDURE REPRODUCIBILITY AND PANELIST VARIABILYrY In compiling data which demonstrate the reproducibility of the outlined procedures, we frequently include a 10% w/w aqueous solution of aluminum chlorohydrol as a reference sample in cross-over studies. These evaluations have always been based on observed shifts in sweating ratios. Values from six 12-panelist studies for this reference are shown in Table VII. These were carried out as cross-over studies with formulated aerosol or lotion antiperspirants. The reference sample was applied by swabbing 0.5- ml aliquots over the designated axillae in Tests 1, 3, and 6, and by applying a 2-sec spray from a Preval©* aerosol unit in Tests 2, 4, and 5. Table VII Comparison of Values (Per Cent Reductions) i •and 2 Hours Following Sample Application Test No. Panelists No. of Applications 3 4 Post-Treatment Interval I hour 2 hours I 12 49.0 ___ 10.0 47.0 ñ 8.6 2 11 43.0 ñ 7.0 41.0 ñ 6.4 3 12 •3.0 ___ 6.8 37.0 ñ 8.1 4 12 33.3 ñ 10.0 31.3 ___ 11.5 5 12 46.4 ñ 7.6 . . . 6 12 37.3 ñ 7.2 32.9 q- 10.0 The variations in reductions in sweating observed in these six studies, 33.3% to 49.0%, are due to the comparative responsiveness of the panelists to appli- cations of aluminum chlorohydrol. This panelist-to-panelist variation is a problem we have not been able to overcome, but can be partially compen- sated for by carrying out evaluations on larger panels of 30 or more. This will overcome the variability to a large extent. It has been suggested that we exclude panelists who do not show a signifi- cant reduction in sweating. Our experiences indicate that this is not advisable. Failure of panelists to show reductions in sweating is not uniform for all test materials, particularly formulated samples. •Manufactured by Precision Valve Corp., Yonkers, N.Y.

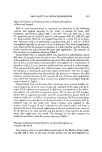
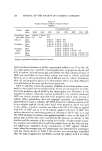
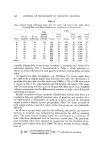
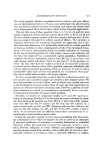
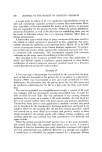
150 JOURNAL OF TIlE SOCIETY OF COSMETIC CHEMISTS Table VIII Per Cent Rednctions in a Single Study on Fonr Market Prodncts Sample Panelist No. A B C D I 40 52 53 46 2 20 0 0 18 3 29 11 12 29 4 10 7 16 0 5 17 3 0 0 6 10 0 4 0 7 30 25 32 59 8 31 20 37 5 9 28 43 52 43 10 6 41 23 23 11 21 41 38 49 12 18 5 13 37 13 6 42 42 34 14 0 0 0 28 15 0 34 53 59 16 0 13 18 40 17 15 47 42 23 18 27 28 19 16 19 16 12 12 0 20 12 40 46 9 21 2 22 19 6 22 15 34 51 16 23 I 42 37 48 24 20 28 26 47 Mean 15.6 ñ 4.5 24.6 4-_ 6.4 26.9 ñ 7.2 26.5 ñ 7.8 Table VIII shows per cent reductions resulting from the application of four market products to 24 panelists. These data are from a recent four-way cross- over study. The panelists employed in this study included an unusually high per cent of individuals who did not respond to active antiperspirant formula- tions. A more typical panel of this size would contain one or two such resis- tant panelists. Samples B and C in this table are very similar and we have evaluated them in many studies. The values obtained in most such studies have shown 35-40% reduction in sweating. Sample D in this study is a formu- lation type which frequently produces axillary irritation. Sample A is a type intermediate between B or C and D. Due to the extreme variation in values obtained in this study, an attempt was made to determine if a correlation could be demonstrated between irri- tation and failure to achieve antiperspirant activity. We determined that Sam- ples B and C were essentially nonirritating when applied under occlusive patches to the panelists in this study. Sample D was found to be moderately irritating to about 50% of the panelists and Sample A was irritating to about
Purchased for the exclusive use of nofirst nolast (unknown)
From: SCC Media Library & Resource Center (library.scconline.org)