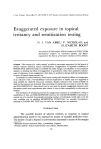
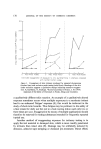
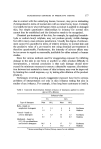
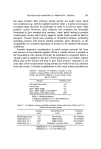
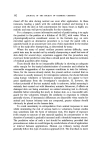
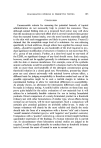
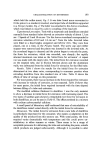
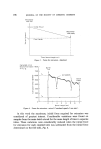
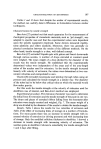
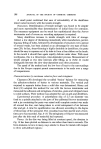
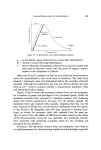
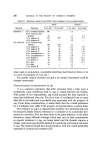
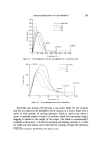
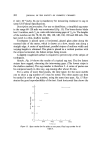
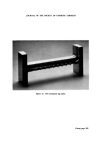
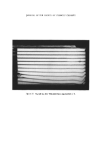
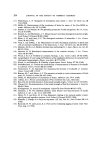
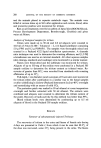
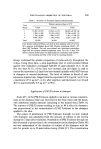
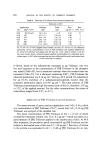
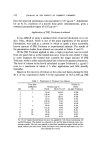
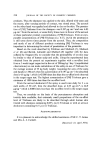
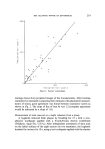
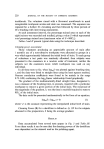
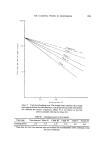
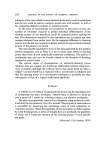
CHARACTERIZATION OF DENTIFRICES 199 M.C.F w A-full recovery '••_•or Extension cm Figure 10. Force-distance curve during adhesion-cohesion. A -- in this elastic region total recovery occurs after deformation B --recovery occurs with some deformation C -- beyond the point of maximum cohesive force, recovery cannot take place and so free flow occurs until the point of rupture, charac- terized as the stringiness or S-factor. Henry and Katz (31) pointed out that the area under the force-extension curve was proportional to the work done in extension. The total force reached a maximum value and diminished before the extended semisolid ruptured. Although the tensile force per unit area did not decline, the total force (g cm-•'x area in contact) reached a characteristic maximum value and diminished before rupture. Results. Table III shows the maximum cohesive force and the stringiness for a number of pastes and mucilages at two crosshead speeds. While the maximum cohesive force increased or remained constant with increasing speed, the S-factor increased in all cases. For all systems studied, the maximum force was reached fairly quickly, indicating that this was the force required to lift the disc over the first few millimetres from the surface. It was found to be dependent upon the time required to develop thixo- tropy, as shown by successive trials with material from the same jar. Figs. 11 and 12 show the effects of differing crosshead speeds on the shape of the force-extension curves for two materials. The maximum cohesive force increased with increasing crosshead speed for the mucilage but decreased for the dentifrice. Discussion. The maximum cohesive force and stringiness were found to be useful parameters for characterizing dentifrices and mucilages, especially

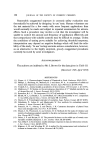
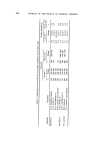
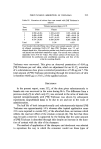
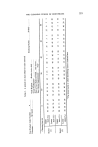
200 JOURNAL OF THE SOCIETY OF COSMETIC CHEMISTS Table III. Maximum cohesive force (MCF) and stringiness at two crosshead speeds Material Thickener MCF S-factor 5 cm min -1 10 cm min -• 5 cm min -x 10 cm min -1 Dentifrice 1 70% Sorbitol 0.3% modified cellulose 240 -- 1.2 -- 0.8 % Carboxy-vinyl polymer 56 -- 3.5 4.4 1.2% Alginate A 215 295 5.6 7.9 1.0% Alginate B 80 -- 9.9 -- 0.5% Carboxy-vinyl polymer 150 185 3.3 -- 1.5% Alginate C 70 95 16 16 1.5% Alginate D 38 45 16 16 1.5% Alginate E 40 40 12 16 0.9% Carragheenan A 64 70 2.4 7.0 0.7% Carragheenan A 58 65 2.8 3.5 2.0% SCMC C 54 68 16 14.2 1.7% SCMC C 20 25 9.2 15.0 20% silica 44 -- 8.8 11.5 19% silica 24 -- 1.3 -- 1.2% SCMC B -- -- 7.5 -- when used in conjunction. Acceptable dentifrices had S-factors below 4 cm at a rate of extension of 5 cm sec-L For quality control of pastes and gels a far simpler instrument could be cheaply constructed. Characterization by measurement of sag It is a common experience that after extrusion from a tube upon a toothbrush, some dentifrices tend to sag or slump between the bristles. With pastes of low dispersibility, sag would increase the time required to clean the toothbrush after use. The slow ooze of toothpaste from an open tube left in the bathroom is probably also associated with the property of sag. From these considerations, it seems likely that the overall preference for a toothpaste may suffer if the property of sag falls below a certain limit. The tendency to sag is a characteristic property of a semisolid and may be measured simply without reference to a container or to a particular pro- cedure for extrusion. This has been done in the paint industry. In the paint laboratory, many different coatings, which may vary in their requirements as regards resistance to sag, are being tested and the chemist requires a simple, rapid and reproducible method for specifying and testing resistance to sag. The method should have good precision, with test results preferably expressed in unequivocal numbers (32).
Purchased for the exclusive use of nofirst nolast (unknown)
From: SCC Media Library & Resource Center (library.scconline.org)