380 JOURNAL OF THE SOCIETY OF COSMETIC CHEMISTS taining otl•cr combinations of the parabcns, any one of the four parabens re- ferred to in this paper may be used as an internal standard to determine the other parabens. In addition, external calibration standards may also be used. Sample Preparation Approximately 10 g of an emulsified sample containing the parabens is weighed into a 50-ml glass-stoppered Edenmeyer flask. The emulsion is bro- ken by acidification with a few drops of 10% w/v sulfuric acid, addition of salts, or other suitable solvents. Ten ml of an internal standard solution of ethylparaben, dissolved in 95% ethanol, are pipetted into the flask. The mix- ture is diluted by the addition of 30 ml of 95% ethanol and shaken vigorously for a few minutes to ensure complete removal of the parabens into the aque- ous/alcohol phase. If required, gentle warming (ca. 60øC.) can be used to melt any lipid pha•se and facilitate extraction of the parabens into the aque- ous/alcohol phase. After "extraction" is complete, the mixture is filtered or centrifuged and a sufficient volume, usually 1-to-2 ml, retained for chromato- graphic analysis. The exact concentration of the internal standard solution and the sensitivity range of the detector will depend on the per cent concen- tration of the parabens in the sample. For levels of 0.1-to-0.2% w/w of me- thylparaben and propylparaben, an internal standard solution having a con- centration of 1.5 mg/ml is satisfactory. A 3-/z injection of the extracted sam- ple produces at least a 50% deflection at 0.64 absorbance units full scale with a 254 nm detector. A realistic detection limit for the parabens is about 30 ng, hence a 10-g sample having a concentration as low as 0.01% is easily ana- lyzed under the conditions described. For suspension-type products, approximately 10 g of sample should be added to a beaker containing 10 ml of internal standard solution and 30 ml of ethanol. The resulting slurry should be stirred for 10 min before filtering, and then the flitrate may be analyzed as above. The exact quantity of alcohol and internal standard solution may be modified to suit the viscosity of the suspen- sion and the levels of parabens expected. No interferences were found from other ingredients in any of the products analyzed however, each case must be evaluated separately in this respect. As a precautionary measure, it is useful to flush the column periodically with 100% methanol to prevent the accumulation of hydrophobic materials at the top of the column. The frequency and duration of column use, as well as the nature of the samples analyzed, will dictate how often the column should be cleaned. Erratic retention data and baseline drift are usually symptomatic of this problem.

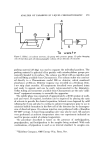
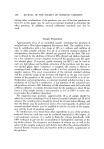
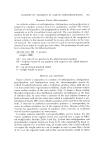
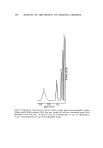
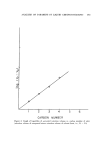
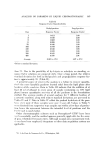
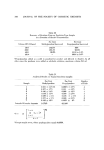
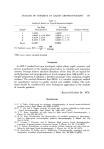
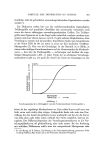
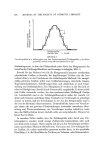
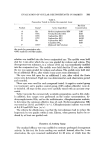
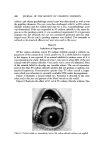
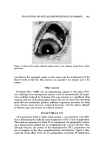
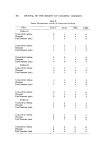
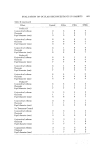
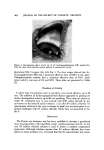
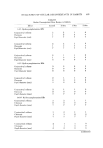
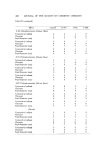
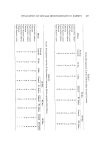
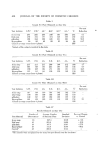
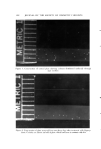
ANALYSIS OF PARABENS BY LIQUID CHROMATOGRAPHY 381 Respom'e Factor Determination An alcoholic solution of methylparaben, ethylparaben, and propylparabcn is prepared to calculate response factors for quantitative analysis. The relative alnounts of methylparabcn and propylparaben should be of the same order of magnitude as in the lornrelation being analyzed. The concentration of ethy]- paraben should be close to the anticipated methylparabcn concentration. Rc- sp:)nse factors are calculated by dividing the weight ratio of the compound of interest, relative to the internal standard, by its area ratio relative to the inter- nal standard. The response factor can then be used to convert experimentally measured area ratios to weight per cent values. The percentage of each para- ben is determined by the following formula AR x RF x IS x 100 =% paraben sample x 1000 AN = area ratio of any paraben to the added internal standard RF = response factor for any paraben with respect to the added internal standard IS =mg of internal standard added S = sample weight in grams RESULTS AND DISCUSSION Figure 2 shows a separation of a mixture of methylparaben, ethylparaben, propylparaben, and butylparaben using the ehromatographie system de- smibed. Parahydroxybenzoie acid, a hydrolysis product, elutes with the sol- vent front under these experimental conditions. A plot of log retention volume versus carbon number of the ester moiety (Fig. 3) shows a linear relation through butylparaben, thus facilitating qualitative identification on the basis of retention data. In cases where a measure of the mass balance between p- hydroxybenzoie acid and the esters from which it originated is desired, a mo- bile phase of nearly 100% water affords separation of the acid from the solvent front. A decrease in methanol concentration produces a corresponding in- crease in column resolution, but at the expense of time. Because of the time e•ement, for quantitative analysis of parabens alone, increases in resolution beyond baseline separation are unnecessary. In routine analysis, reliab!lity and reprodueibility are key factors. For this reason, variations in the response factor were assessed over a range of differ- ent weight ratios. Results (Table I and Fig. 4) show that methylparaben and propvlparaben response factors are linear to 3% when calculated by linear re- grossion analysis over a ten-fold range of weight ratios. One would ordinarily not expect the weight ratios in a set of samples to vary by more than a factor of two over the expected result, and in this case the lincarity would be better
Purchased for the exclusive use of nofirst nolast (unknown)
From: SCC Media Library & Resource Center (library.scconline.org)