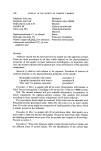
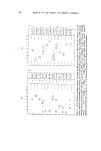
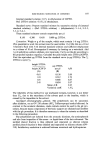
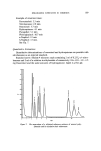
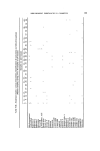
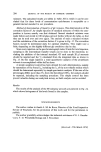
RISK-BEARING SUBSTANCES IN COSMETICS 201 of the standard peak J mixture (% by weight) • areas j •9'•2% 116 385270 Propel lant 12 16.97% 308 164351 Propel lant II 6.67% 483 121485 Acetone 1.71% o 745 34789 Methanol 13.19% 848 180125 Dichloromethane 6,69% 1095 100240 CYCLOHEXANE 3.33% 1222 64271 Ethanol 6.85% c,• 1363 653•4 Methylchloroform 3.31% o 1528 56729 isoPropanol 1.96% I 1752 29130 Nitrometha IOO.OO% o Figure 12. Example of the determination of correction factors F. 20 pl of a standard mixture of known composition are injected. The correction factors F are calculated by the formula: Fx xx As in which Fx is the correction factor of compound 1 xx is the weight per cent of compound 1 in the mixture s is the weight per cent of internal standard in the mixture (Cyclohexane) Ax is the integrated peak area of compound 1 A s is the integrated peak area of the internal standard cyclohexane. The calculated correction factors are: Propellant 12 = 1.53 Methanol = 0.74 Methylchloroform = 1.57 Propellant 11 = 1.55 Dichloromethane = 1.10 isoPropanol = 0.87 Acetone = 0.82 Ethanol = 0.78 Nitromethane -- 1.01

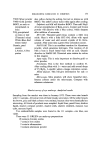
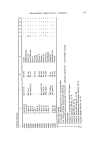
202 JOURNAL OF THE SOCIETY OF COSMETIC CHEMISTS prevent fouling of the main column. The resolution for the solvents and pro- pellants of hairspray aerosols was satisfactory, except for Propellants 12/114, and for isobutane/dimethylether (Table IX). Before proceeding with the analysis, some important questions--specific to this type of analysis--had to be considered. How reliable is a glc-injection with the system? To answer this question one transfer vessel was filled with a hairspray aerosol sample (+ internal standard) and 10 successive injections of 20 I•1 were made. From the integrated glc-data the •o of the solvents and propellants were calculated. Statistical evaluation gave the following coefficients of variation: P12 (1.4•o), P11 (1.3}/o), DCM (1.5•), EtOH (2.5•). It can be concluded that the sampling and injecting system is quite reliable (Table X). Table X. Reliability of 10 successive injections of the same liquid mixture One small (10 ml) all-glass aerosol bottle was filled with a hairspray aerosol sample and an internal standard added. The liquid mixture was analysed by 10 successive injections according to the method and the integrated peak areas were used to calculate the % of the volatile com- ponents. The calculated % are: 1 27.4% P12 54.8% Pll 5.25% Dichloromethane 6.76% Ethanol 2 27.1 54.5 5.16 6.79 3 27.3 55.0 5.22 6.91 4 27.5 55.2 5.45 7'21 5 27.2 55.5 5.25 7.14 6 26.8 54.1 6.34+ 6.74 7 26.5 53.5 5.76+ 6.69 8 27.3 55.1 5.23 7.10 9 27.8 55.9 5.27 7.02 10 27.3 55.0 5.24 6.92 Mean 27.2 54.9 5.26 2.69 Standard deviation 0.4 0.7 0.08 0.20 Variation coefficient 1.4% 1.3% 1.5% 2.5% + Abnormal results. Experimental Can an aerosol sample be analysed at any emptying stage, or in other words will the composition of an aerosol change during use? To find the practical answer one container was sampled several times according to the method, while releasing it between the sampling. The results of the analysis of the five small aerosol bottles for the intermediate transfer are given in Table XI. It proves that sampling can be done at any emptying stage, except when the can is nearly empty.
Purchased for the exclusive use of nofirst nolast (unknown)
From: SCC Media Library & Resource Center (library.scconline.org)