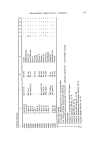
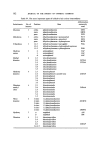
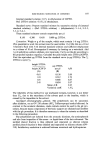
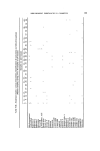
RISK-BEARING SUBSTANCES IN COSMETICS 203 Table XI. Composition of a hairspray aerosol during its use A single hairspray aerosol is sampled five times for analysis, at different stages of emptying. The following data were obtained: 'Full' 'Empty' = 530 g Removed Removed Removed 30 g net weight 200 g 300 g 400 g left Propellant 12 29.8% 29.4% 29.3% 28.5% 23.8% Propellant 11 45.0 45.1 45.1 45.8 46.6 Acetone 0.30 0.29 0.30 0.23 0.28 Dichloromethane 22.7 22.6 22.7 22.5 26.6 Ethanol 4.4 4.4 4.0 4.1 4.7 Is the injected volume of importance? Generally speaking, the introduction of an internal standard makes the volume of the injected liquid of no importance. But in this kind of analysis another important factor must be considered, namely that the 'dead' volume of the needle must be negligible in comparison with the injected volume. Experimentally the minimum volume was 15 pl. In all our experiments the volume is standardized to 20 I•1 to obtain optimal reliability. Is one general standard (cyclohexane) acceptable for such a mixture of dif- ferent kinds of organic compounds (alkanols, alkanones, hydrocarbons, fluorin- ated and chlorinated hydrocarbons)? The linearity of the response for certain practical concentration levels was checked by analysing three different reference Table XII. Reliability of the use of cyclohexane as a general internal standard Three different standard mixtures, containing nine compounds and cyclohexane were analysed by glc. From the integrated peak areas the correction factors F were calculated by the formula F = xdS) (As/A0. % by weight Correction factors Concen- tration A B C A B C levels Propellant 12 39.3 21.4 28.4 1.52 1.53 1.47 20-40% Propellant l 1 17.0 8.9 26.6 1.58 1.55 1.53 10-30% Acetone 6.7 18.0 13.3 0.86 0.84 0.80 5-20% Methanol 1.7 4.6 3.2 0.77 0.74 0.72 1-5% Dichloromethane 13.2 18.0 6.6 1.19 1.12 1.10 5-20 % Cyclohexane 6.7 6.1 6.6 I 1 1 Ethanol 3.3 4.5 1.9 0.78 0.81 0.79 2-5% Methylchloroform 6.8 12.4 9.9 1.55 1.57 1.57 5-15% isoPropanol 3.3 4.6 1.9 0.84 0.87 0.84 1-5% Nitromethane 2.0 1.5 1.6 1.03 1.00 1.18 1-2% Conclusion: For these levels of concentration cyclohexane as a general internal standard is acceptable, except for nitromethane.

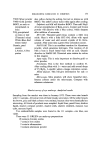
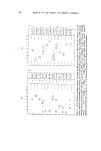
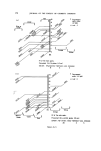
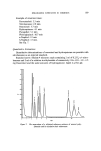
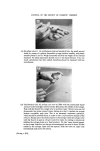
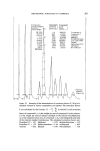
204 JOURNAL OF THE SOCIETY OF COSMETIC CHEMISTS mixtures. The calculated results are tables in Table XII in which it can be con- cluded that for these levels of concentration cyclohexane is acceptable as a general internal standard in our procedure. Method of determination of linearity of glc response. The determination of the correction factors F, by simple injection of standard mixtures of which the com- position is known exactly was first obtained. Several standard mixtures were made before and stored in 100 ml glass aerosol bottles without dip tubes, so that they can be used over and over again. The analysis of such a standard mixture and the calculation of the correction factors F is given in Fig. 12. The correction factors should be determined daily for optimal reliability. They might vary a little, depending on the slightly different glc conditions day by day. Since every injection on the gas chromatograph takes 30 min for total response, sampling in the intermediate transfer vessels can be done in the meantime, in- cluding the addition of the internal standard. Of each sample 20 Ixl amounts should be injected and the •o calculated from the integrated data as shown in Fig. 13. By this single injection a total quantitative analysis of the propellants solvents is accomplished within half an hour. A simple analytical control has been devised for each determination, namely by summation of the found •o, including the • of the non-volatile residue which should be determined separately by simple gravimetric analysis. If the sum of the percentages differs more than 5•o from the theoretical 100•o, the analysis should be repeated, including the sampling procedure. This simple control has been proved valuable during our analytical survey, as fault analysis can be avoided. Results The results of the analysis of the 60 hairspray aerosols are pictured in Fig. 14, which shows histograms of the levels found in the samples. ACKNOWLEDGMENTS The author wishes to thank A.M. de Roos, Director of the Food Inspection Service of Enschede, for his promotion of this work and for the permission to publish. The author gratefully acknowledges the technical assistance of G. J. Runder- voort, T. D. Wesseldijk-Osinga and J. Rooselaar. (Received: 27th March 1974)
Purchased for the exclusive use of nofirst nolast (unknown)
From: SCC Media Library & Resource Center (library.scconline.org)