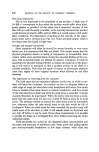
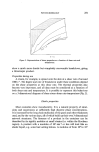
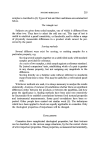
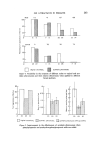
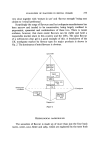
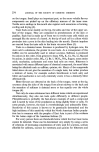
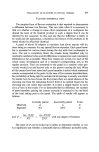
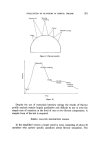
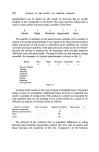
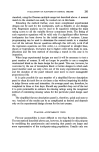
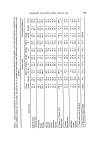
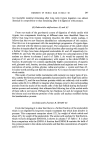
282 JOURNAL OF THE SOCIETY OF COSMETIC CHEMISTS questionnaire can be based on the results of previous flavour profile analysis of the toothpastes to be tested. The same intensity rating scale is used or some similar five-point scale, possibly of the form 0 1 2 3 4 Absent Slight Moderate Appreciable Great The number of members on the panel is some multiple of the number of creams to be tested and preferably in the region of 30. Using random number tables allocations of test cream to individual panel members are worked out such that equal numbers of the panel use each cream on the first brush- ing and the process is repeated for all brushings until all panel members will brush once with each cream. The panel is then run and intensity ratings recorded. An example of a typical questionnaire is shown in Fig. 11. Rating None Slight Moderate Appreciable Very 0 1 2 3 4 Flavour strength Tingling Warming Sweetness Freshness Drying Bitterness Lasting flavour Figure 11 Analysis of the results of this type of panel is straightforward. The panel design is that of a completely randomized block and can be subjected very easily to analysis of variance (12). This analysis is carried out separately for each question and, for the example of six creams tested by a panel of 30, will give an analysis of variance table as follows/ Source of variation Sum of squares Degrees of freedom Mean square Between toothpastes ........... 5 ........ Between panel members ........... 29 ........ Error ............ 145 ........ Total ............ 179 F The removal of the variation due to systematic differences in rating between panel members appreciably reduces the error sum of squares and hence increases the sensitivity of the test. Comparison of' the between

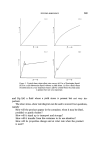
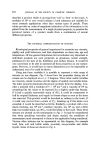
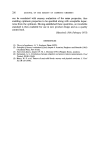
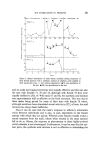
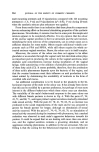
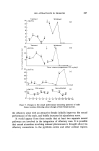
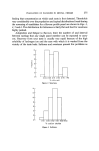
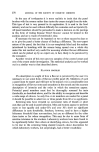
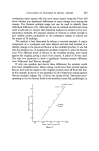
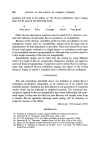
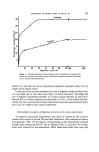
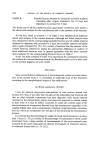
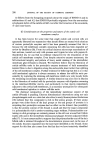
EVALUATION OF FLAVOURS IN DENTAL CREAMS 283 toothpastes mean square with the error mean square using the F-test will show whether any significant differences in mean ratings exist among the creams. The Duncan multiple range test can be used to identify these individual differences (13). Although the use of a limited and discrete rating scale would seem to require that statistical analysis be carried out by non- parametric methods, the classical analysis of variance is robust enough to give reliable results, particularly as the toothpaste ratings of interest are the means of 30 readings. The method is best illustrated by taking a concrete example. A major component of a toothpaste had been altered and this had resulted in a definite change in the perceived flavour of the modified product. It was felt that the simplest way of tackling the problem would be to alter the flavour level. Five different levels of flavour in the modified product were tested against the original, giving a total of six creams. A panel of 30 was used. The only two questions to show a significant 'between creams' difference were 'bitterness' and 'flavour strength'. If only one question had shown these differences the solution would have been straightforward. Mean ratings would have been plotted against flavour level and the match to the original product read off from this line. In the example, however, it was necessary to plot 'bitterness' ratings against 'flavour strength' ratings. Fig. 12 shows the results of this. The points corre- sponding to the five flavour levels in the modified cream fall, gratifyingly, in c• 1.6 1.0 Modified product Flcvour level/ 5 x' :5 x '/ Original 0 product 2x / I x' / 2.4 2'6 2'8 Mean flavour strength rate Figure 12
Purchased for the exclusive use of nofirst nolast (unknown)
From: SCC Media Library & Resource Center (library.scconline.org)