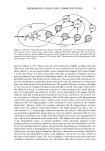
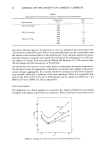
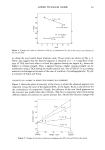
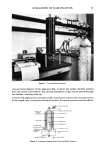
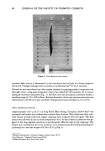
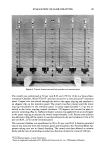
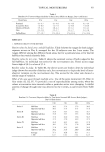
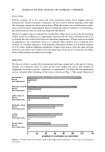
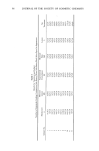
74 JOURNAL OF THE SOCIETY OF COSMETIC CHEMISTS RESULTS AND DISCUSSIONS TWIST RETENTION ANALYSIS--TEST VARIABLES During the study of Twist Retention Analysis, a number of variables were investigated, i.e., the weight of hair per swatch, amount of applied twist, air flow rate, and swatch reuse characteristics after shampooing. It was found that at a fixed degree of twist, as the number of hair fibers (weight) per swatch was increased, the Twist Retention increased. This was reasonable since, as the number of hair fibers in the sample is increased, the number of cross-over points per unit length was also increased. This resulted in an increased number of hair-to-hair bonding sites. To eliminate hair weight as a test variable, a constant weight of 0.20 to 0.21 g per swatch was selected. The amount of applied twist was varied and studied between 180 and 900 degrees in 180 degree increments. Five replicate samples were evaluated at each twist increment and statistically compared. As the twist was increased, the coefficient of variation (For- mula IV) decreased (increased precision) and was minimized above 540 degrees. An applied twist of 720 degrees was selected as optimum. Air flow rate was varied between 15 and 200 ml/min. Flow rates below 40 ml/min gave rise to non-reproducible results, while the flow rates above 55 ml/min gave constant Twist Retention/time relationships. Sample-to-sample reproducibility at 40 ml/min or below was poor, while at or above 55 ml/min it was significantly (acceptably) improved. Under low flow rate conditions it is suspected that the hair/fixative com- posite partially dehydrates the air, giving a non-reproducible Twist Retention response. Swatches were tested after 20 fixative application/shampoo cycles to study the effect of possible swatch deterioration. No significant differences were observed between the first and the last shampoo cycle. Swatches were, however, discarded after 20 shampoo cycles. STATISTICAL ANALYSIS Resins A through E, evaluated by both Curl and Twist Retention Analysis--Set I, were compared using standard statistical techniques. Coefficient of variation, correlation coefficients, and confidence of difference between resins were calculatd as a function of time. TABLE II COEFFICIENT of VARIATION RESIN TWIST RETENTION CURL RETENTION SET I SET I AVERAGE 0 VERALL AVERAGE 0 VERALL TIME INTER VALS TIME INTER VAL S A 9.2 17.1 B 10.7 20.5 C 9.1 24.2 D 7.9 20.0 E 4.7 11.9

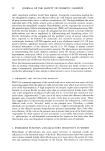
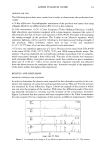
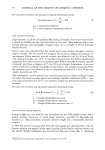
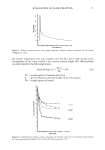
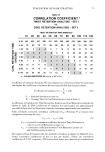
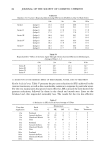
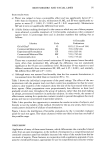
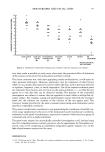
EVALUATION OF HAIR FIXATIVES 75 TABLE III CORRELATION COEFFICIENT TWIST RETENTION ANALYSIS - SET I VS. CURL RETENTION ANALYSIS - SET I TWIST FIETENTION TIME (MINUTES) 10 20 30 40 50 6 0 70 80 90 100 110 120 LU !--n' Z::3 LUO 0.25 261 335 357 338 317 303 289 282 276 282 294 305 0.50 43 62 76 70 68 68 69 75 90 111 140 165 ::::::::::::::::::::::::::::::::::::::::::::::::::::::::: 1.00 38 6 ii!iii'iiiiiiiii!i!•ililiiiiiiiiiiiiiiiiiii'•iiiiii 6 7 10 15 29 47 72 95 21.00 22 30 30 25 17 12 9 15 a - VALUES REPORTED AS=(1-r) x 103= Cxy ::::::::::::::::::::::::::::::::::::::::::::::::::::::::::: Coefficient of variation (Formula IV) was computed as a function of time for each resin (the higher the coefficient of variation the less reproducible the test procedure). Coefficient of variation (%) St =-- x 100 (IV) Xt St = Standard deviation at time (t) Xt = Average Twist or Curl Retention per cent at time (t) Coefficients of variation for Twist Retention Analysis and Curl Retention Analysis are shown in Table II. TRA coefficients of variation for each fixative are approximately one-half of those for Curl Retention Analysis, indicating significantly less variability. Table III shows corrected correlation coefficients (Cx,) (Formula V) at various time comparisons between the tests. Cx, = (1 - rx,) x 100 (V) Cx, = corrected correlation coefficient between Twist Retention at time (x) and Curl Retention at time (y) rxy = correlation coefficient between Twist Retention at time (x) and Curl Retention at time (y) The region of best fit between the two methods of analysis is shaded in Table III. Cor- rected correlation coefficients of five or less are shaded. (These are correlation coefficients of 0.995 or greater.) TRA after short times was observed to correlate best
Purchased for the exclusive use of nofirst nolast (unknown)
From: SCC Media Library & Resource Center (library.scconline.org)