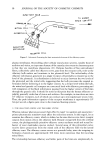
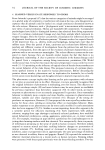
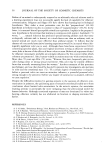
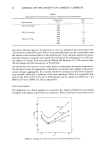
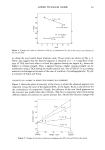
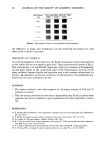
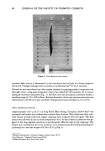
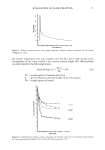
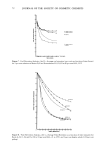
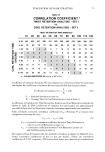
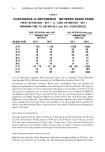
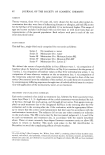
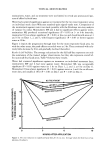
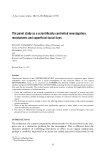
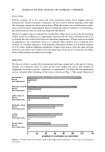
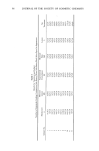
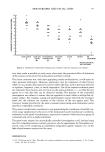
76 JOURNAL OF THE SOCIETY OF COSMETIC CHEMISTS TABLE IV CONFIDENCE of DIFFERENCE BETWEEN RESIN PAIRS TWIST RETENTION - SET I vs. CURL RETENTION - SET I (MINIMUM TIME TO OBTAIN 95% and 99% CONFIDENCE) TWIST RETENTION ANALYSIS CURL RETENTION ANALYSIS MINIMUM TIME MINIMUM TIME (MINUTES) (MINUTES) RESIN PAIR 95% 99% 95% 99% A-B 120 120 1260 1260 A-C 10 10 30 60 A-D 10 10 30 30 A-E 10 10 30 30 B-C 10 10 15 15 B-D 10 10 15 15 B-E 10 10 15 15 C-D 10 70 10 20 60 90 1260 C-E 10 10 60 180 D-E 60 80 240 1260 to Curl Retention Analysis after extended times. As an example, Twist Retention Analysis after 90 to 100 min correlates to Curl Retention Analysis after 21 hr. Confidence of difference between Resin pairs (probability that one fixative has improved performance over another) was calculated as a function of time. The time re- quired for one fixative to show improved performance over another at 95 per cent and 99 per cent confidence was recorded for each Retention test as shown in Table IV. (Confidence intervals of 95 per cent and 99 per cent are commonly chosen to relate to significant and highly significant differences respectively.) For each Resin pair, where differences were observed, Twist Retention required a shorter time than Curl Reten- tion to reach 95 per cent and 99 per cent confidence. As an example, Resin pair D-E re- quired only 80 min with TRA to achieve 99 per cent, while Curl Retention Analysis re- quired 1260 min. RESIN PICKUP MEASUREMENTS Average fixative pickup values for Resins A through E and Formulations D1, E1 and E2 were determined. Pickup values of 0.04 per cent, 0.09 per cent, 0.19 per cent and 0.43 per cent correspond to 0.50 per cent, 1.0 per cent, 2.0 per cent and 4.0 per cent fixative solution concentrations. These pickup values at a given solution concentration were found to be independent of resin type in the fixative composition. TWIST RETENTION VERSUS FIXATIVE PICKUP Resin E was tested by Twist Retention Analysis at average pickups of 0.04 per cent, 0.09 per cent and 0.43 per cent (Fig. 10). Decreasing pickup showed significantly faster

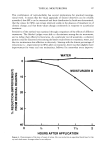
EVALUATION OF HAIR FIXATIVES 77 lOO 0.04% PICKUP 10 20 30 40 50 60 70 80 90 100 110 120 TIME (MINUTES) Figure 10. Twist Retention per cent vs. time for Resin E at 0.04 per cent, 0.19 per cent, 0.43 per cent pickup (weight) on hair rates of untwisting as a function of time, indicating the necessity for maintaining constant pickup when making fixative comparisons. FIXATIVE FORMULATION WITH PLASTICIZER Resins D and E, formulated with 15 per cent plasticizer (by weight) were evaluated by both Twist and Curl Retention Analysis (Figs. 7, 9). Statistical comparisons (correlation coefficient) showed excellent agreement between the two tests. Twist Retention Analysis, employing only two replicate samples per fixative, was able to determine differences between fixative pairs E-E1 and E-E2 at a 99 per cent confidence interval after 80 min. Curl Retention Analysis, employing seven replicate samples per fixative, was not able to distinguish a significant difference at the 95 per cent confidence level, even after 21 hr. CONCLUSIONS AND SUMMARY A new laboratory test, Twist Retention Analysis (TRA) was described as a tool to evaluate fixative performance on hair with the use of a Torsional Braid Analyzer. Statistical correlation between TRA and classical Curl Retention Analysis was shown to be excellent (correlation coefficients of 0.995 or greater). Curl Retention Analysis re-
Purchased for the exclusive use of nofirst nolast (unknown)
From: SCC Media Library & Resource Center (library.scconline.org)