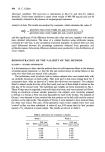
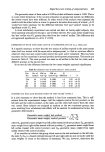
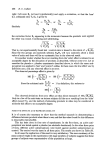
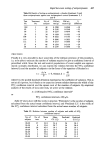
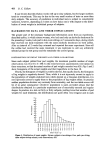
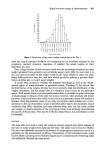
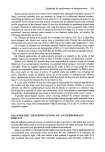
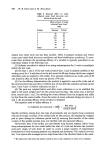
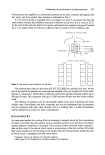
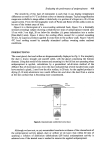
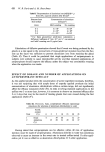
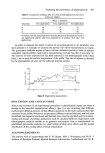
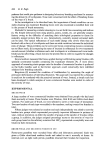
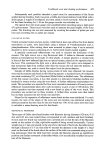
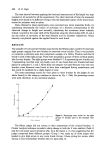
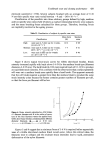
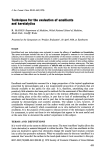
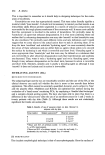
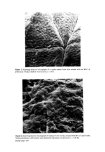
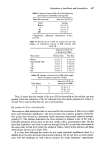
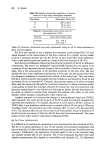
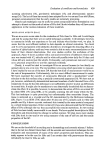
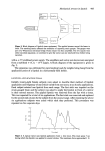
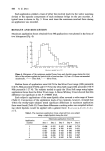
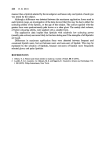
426 B. R. Pugh The time interval between applying the load and measurement of the height was kept constant at 45 seconds for all the experiments. For other intervals of time, the measured heights were found to be different owing to the time dependent nature of the stress-strain curves for polymers such as nylon. Data obtained in these experiments were converted into strain intensities firstly, by calculating theoretically the radius of curvature of a filament corresponding to the observed change in height and secondly, calculating the maximum strain intensity (which occurred in the outer shell of the filaments) using the relationship d/2R. R and d are the radius of curvature of the bent filament and its diameter respectively. Strain intensity was plotted against the applied force for each brush. RESULTS The samples of worn and new brushes examined by the fifteen judges could be formed into eight groups ranging from new brushes to extremely worn brushes. Thus it was possible to construct a reference scale that comprised a sample of a Gibbs, Wisdom and Oral B brush in each of the eight groups. These were mounted in groups of three on black plastic tiles for easy display. The eight groups were labelled 0-7, 0 representing new brushes and 7 representing ones that were very badly worn. It was found that new brushes had been placed in categories 0, 1 and 2. More than one category was used because even with new brushes, some filaments were found to have been misaligned during manufacture and this could be mistaken for a slight degree of wear. The mean percentage scores for wear given to these brushes by the judges do not relate linearly to the category numbers as shown by Fig. 1. Only the percentage scores were used, therefore, in any statistical analysis. ioo 50 25 0 I oe 3 4 5 6 7 Wear category Figure 1. Percentage wear scores for the eight groups of brushes used in the standard wear scale. The fifteen judges did not concur in their assessments of the original brushes. A Cluster Analysis technique revealed a sharp change in both the F ratio statistic (Table i) and the root-mean square deviation (Fig. 2) in the region n=3, thus suggesting that the judges comprised three different groups: Group 1 was made up of those judges who tended to give high scores to any worn brush, Group 3 those giving low scores, while Group 2 were intermediate between the two types (Fig. 3).

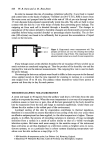
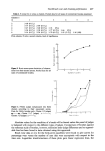
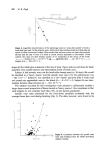
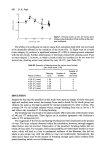
Toothbrush wear and cleaning performance 427 Table I. F ratios for rn versus n clusters. Pooled data for all types of commercial brushes examined Clusters n rn 1 2 3 4 5 6 3'60 (0'1%) 3-77 (0' 1%) 2' 89 (0' 1%) 3-47 (0'1%) 2'49 (0'1%) 1'74 (5%) 3'34(0-1•o) 2'38 (0'1%) 1'77 (0'5%) 1-66 (5%) 3'16 (0-1%) 2'24 (0'1%) 1'70 (0'5%) 1-55 (2'5%) 1'36 (NS) First column, F ratio second column, level of significance. Figure 2. Root mean square deviation of observa- tions from their cluster centres. Pooled data for all types of commercial brushes. 40- 30- 20- I I I -' I , I 2 3 4 5 6 Number of clusters Figure 3. Fifteen judges sub-grouped into three clusters according to their assessment scores. Data for Gibbs brushes only. Cluster 1 (5 judges) ß O Cluster 2 (7 judges) x x Cluster 3 (3 judges) O O. !oo - 75-- 50- 25[ 0 Vveor c9te'3ory Absolute values for the condition of a brush will be biased unless the panel of judges is balanced with respect to the different types of judges. Comparison of brushes against the reference scale of brushes, however, minimises inter-judge differences and no appreci- able bias has been found in data obtained using this approach. Brush wear data in vivo for the forty-seven panellists were found to give curves for percentage wear versus the number of uses that were asymptotic with respect to the time axis. Logarithm transformations of these plots gave linear regression lines, the
Purchased for the exclusive use of nofirst nolast (unknown)
From: SCC Media Library & Resource Center (library.scconline.org)