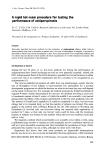
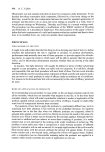
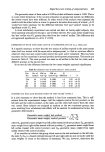
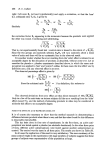
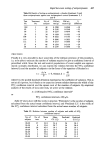
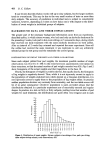
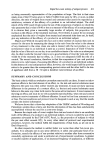
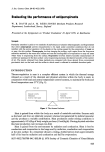
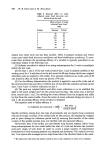
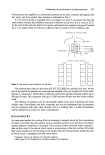
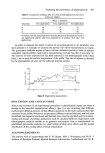
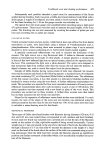
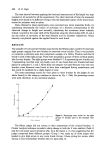
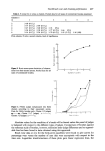
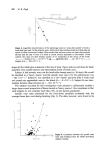
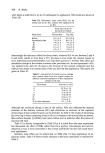
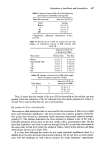
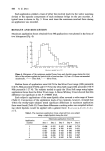
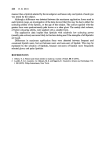
428 B. R. Pugh Number of uses 25 50 75 I00 125 ,- I x '----x--x- ' ø\ Figure 4. Logarithm transformation of the percentage wear (w) versus the number of times a brush had been used. All the subjects used a Gibbs short-head medium brush, but these data are typical of other commerical brushes. Other studies that we have carried out clearly demonstrate the fact that the rate of wear of a brush is almost entirely dependent on the subject. Those subjects who wear out their brushes quickly do so irrespective of the nature of the brush. X X Subject C (k= -8x 10-•t-x) • O (Subject B (/c= -44x 10-4t-•) 0 0 Subject A (k = - 383 x 10 -• t -x) . slopes (k) for which gave a measure of the rate of wear. Figure 4 shows such lines for three panellists who caused extreme and intermediate levels of brush wear. Subject A had severely worn out his brush after twenty uses (i.e. 10 days). He would be classified as a 'heavy wearer' and the specific wear rate k for his performance was -383 x 10 -4 t -x. Subject C was classified as a 'low wearer' and even after 8 weeks had not caused any appreciable wear to the brush (k= - 8 x 10 -4 t-x). Subject B was inter- mediate between these extremes (k=-44 x 10 -4 t-x). The subjects recruited for this investigation were selected to deliberately include a larger than normal proportion of those classed as 'heavy wearers'. Our experience is that such subjects do not comprise more than 10•o of any typical population. Specific wear rates calculated for the forty-seven panellists correlated with the average forces they used during brushing (Fig. 5). The data, however, were found to be /,- - 5o( ¸ _ - •ZO0 / I / / / / ß / / / / t / Force (N) i 2o Figure 5. Correlation between the specific wear rates and brushing forces for Gibbs short-head medium brushes.

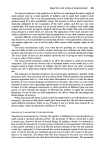
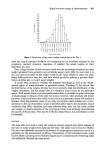
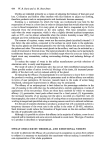
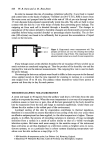
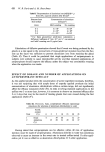
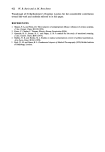
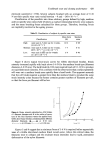
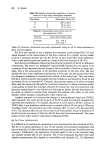
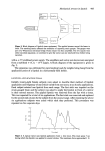
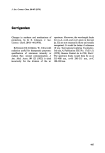
Toothbrush wear and cleaning performance 429 extremely scattered (r=0'50). Several subjects brushed with an average force of 9-10 N yet their specific wear rates varied between - 9 and - 240 x 10 -4 t -x. Classification of the panellists into three arbitrary groups defined by high, medium and low specific wear rates (Table H) shows a marked relationship between wear category and the mean brushing forces calculated for these groups. Therefore, brushing forces are implicitly involved in the ageing process. Table II. Classification of subjects by specific wear rates Mean force Standard Classification (N) error High wear scale 6, 7 after use for 4 weeks. 10.2 0.69 (k•84x 10 -4 t -•) Medium: wear scale 4, 5 after use for 4 weeks. 7.7 0.51 (28.5 x 10 -4 t-•k 84x 10 -4 t -•) Low: wear scale 3 after use for 4 weeks 6.4 O. 40 (k 28.5 x 10 -4 t -•) Figure 6 shows typical force-strain curves for Gibbs short-head brushes. Strain •ntensity increased rapidly with loads above 5-6 N for the medium brush type (filament diameter, d, 0'25 mm). The hard brush (d, 0.33 mm) required loads of 12-13 N to produce an equivalent strain intensity. This correlates with the observation that a subject generally will wear out a medium brush more quickly than a hard brush. The apparent anomaly that the soft brush required a greater force than the medium brush to produce the same strain intensity arises because the former contains greater numbers of filaments per tuft, so that the force per filament will be less. Figure 6. Strain intensity calculated as d/2R (where d = filament diameter and R is the radius of curva- ture of the bent filament) versus the applied load. Gibbs short-head brushes containing three different diameter filaments. ß ß d, 0.33 mm x -- x d, 0-25 mm (3 (3 d, 0.20 mm. E 0.0• c_ 5 Force ( N ) I 15 20 Figures 5 and 6 suggest that a minimum force of 5-6 N is required before appreciable wear of a Gibbs short-head medium brush would occur. Above this critical value, the filaments tend to collapse and the resultant strain intensities lead to rapid, permanent deformation of the nylon filaments.
Purchased for the exclusive use of nofirst nolast (unknown)
From: SCC Media Library & Resource Center (library.scconline.org)