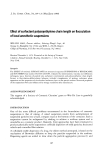
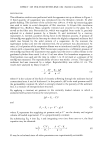
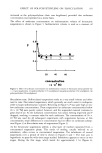
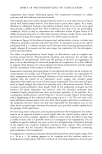
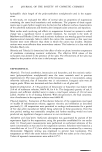
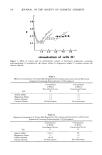
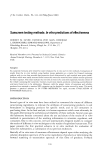
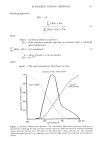
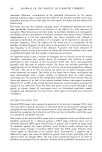
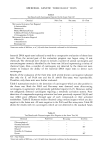
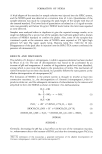
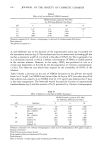
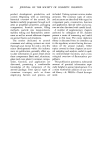
SUNSCREEN TESTING METHODS 137 following equations: SPF = I/T •. E E(X) x I(X) •. EE(X) x I(X) x T(X) where EE(X) = erythermal efficiency spectrum I(X) = Solar simulator intensity spectrum as measured with a calibrated spectroradiometer. • EE(X) x I(X)= 1.0 (normalized) (2) X = 290 to 320 nm in 5 nm increments T(X) = 10 -abs(x) where abs(X) = The sunscreen product absorbance on skin. CONVOLUTION SPECTRUM 1.O - ,.... • .•. ERYTHEMA".. ,' SOLAR • ".. / • ,,'SIMULATOR m 0.6- •J 0.4- 0:0.2- ' I I 290 300 310 320 NM WAVE LENGTH Figure 1. Erythemal Effectiveness Spectrum. The convolution effectiveness spectrum (solid line) is obtained by multiplying the solar simulator emission spectrum (dash/dot line) by a reciprocal erythemal energy spectrum (dotted line). The peak of this spectrum is about 304-305 nm. The erythemal effectiveness spectrum will vary depending upon both the light source and erythemal action spectrum chosen.

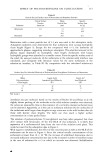
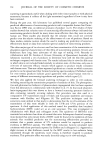
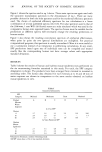
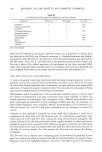
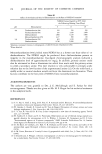
138 JOURNAL OF THE SOCIETY OF COSMETIC CHEMISTS Figure 1 shows the spectra used in eq 2 above. These same spectra are again used with the sunscreen transmission spectrum in the denominator of eq 1. There are many possible choices for both the solar spectrum and for the erythemal efficiency spectrum used. The choice of erythemal efficiency spectrum for our calculations is a linear combination of several published spectra (16,17,18). The solar spectrum used is that of the 2500 watt, 1 mm WG-320 filtered xenon arc solar simulator which was used in the comparative human tests reported herein. The spectra chosen must be suitable for the predictions as different spectra will necessarily change the resulting predictions or human results. Figure I also shows the resulting convolution spectrum of erythemal effectiveness, when point by point the two spectral distributions are multiplied. For practical computational purposes, this spectrum is usually normalized. Often it is more useful to use a summation instead of an integration in performing calculations. In any event, SPF predictions based upon sets of individual tests can be compiled and treated exactly like the corresponding human test data: average values with appropriate standard deviations. RESULTS Table I shows the results of human and hairless mouse epidermis tests performed on the six sunscreening formulas examined in this study. For each, the SPF category designation is shown. The products have been arranged from minimal to maximal in ascending order. The human data obtained for each formula at O, 10 and 40 min of water exposure are shown in comparison to the same results obtained on hairless mouse epidermis in vitro. Table I Sunscreen Substantivity SPF Category Minimal Moderate Extra Maximal Product Minutes Water Exposure Human 0 10 40 Hairless Mouse Epidermis 0 10 40 A B C D E F In Vivo SPF + 2.7 5.6 5.3 5.9 13.9 2.8 3.8 4.7 -- -- 2.8 3.7 5.1 5.8 • 8.0 • In Vitro Predicted SPF 2 14.0 1.4 -- 2.7 5.3 4.8 7.8 13.0 12.0 2.6 2.5 3.6 7.4 6.4 1.0 2.5 2.4 3.6 6.5 7.0 1.0 •Obtained in 40-minute, outdoor swimming study. •All SPF values have a 25% or less standard deviation.
Purchased for the exclusive use of nofirst nolast (unknown)
From: SCC Media Library & Resource Center (library.scconline.org)