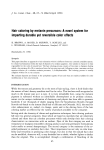
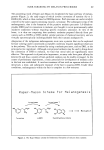
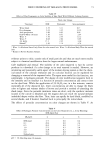
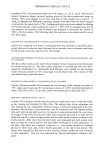
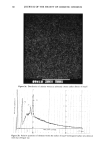
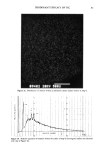
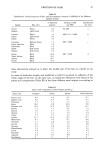
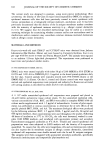
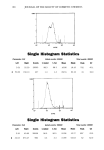
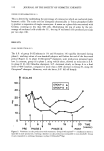
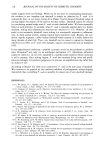
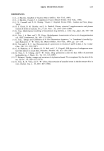
104 JOURNAL OF THE SOCIETY OF COSMETIC CHEMISTS 1 ooo o o o I I [ i 10 • 10 • IA-PE i i i i iii Single Histogram Statistics Parameter: FL2 Left Right 3.21 52.20 a 53.63 150.13 Gated events: 30000 Events % Gated % Tot Mean Mode 29503 98.3 98.3 16.86 18.15 427 1.4 1.4 69.51 63.10 Totaleven•:30000 Peak CV 702 45.1 31 19.0 1000 0 I I•I Illll I I I IIII 10 0 10 • 10 3 i i i i i iii I i 10 • IA-PE Single Histogram Statistics Parame•FL2 Left Right 2.19 40.90 42.03 973.27 GaUd even•:30000 Events % Gated % Tot Mean Mode 28938 96.5 96.5 12.96 10.27 990 3.3 3.3 72.99 53.63 Totaleven•:30000 Peak CV 897 43.5 52 62.0

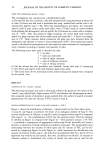
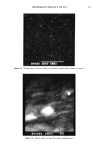
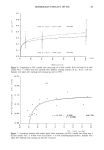
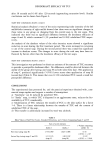
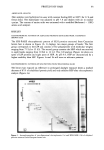
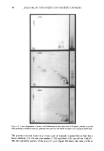
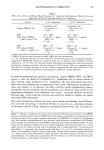
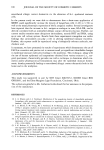
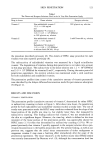
ANTIOXIDANTS IN IMMUNITY 105 Table I Effect of AA, BHA, and BHT on Mean Phenotypic Ia q- Epidermal Cell Expression: Effects of Low- and High-Dose AA With Antioxidant on Mean Ia + Expression Control % Ia+ Expression % Ia + Expression Diluent (DMSO)* 3.81 Arachidonic acid Arachidonic acid 66 ng AA 4.72 666 AA ng 1.42 (+ 24%) (- 63%) BHA AA + BHA AA + BHA BHA diluent (DMSO) 66 ng AA + 5 •xg/ml 666 ng AA + 5 •xg/ml + BHA 5 •xg/ml 2.88 BHA 3.62 BHA 2.11 (q' 25%) (-27%) BHT BHT + AA BHT + AA BHT diluent (DMSO) 66 ng AA + 2.5 I-tg/ml 666 ng AA + 2.5 •xg/ml + BHA 2.5 •xg/ml 3.99 BHT 4.44 BHT 3.00 (q. 11%) (-25%) * DMSO: 100 Ixl was used as delivery for BHT, BHA, and AA concentrations. 4 ( 105 unenriched epidermal cells were plated into 24-well polystyrene plates containing antioxidant- supplemented RPMI-1640 followed by a pulse of either low- or high-dose AA. Following a 48-hour incubation at 37øC, 5% CO2, the cells were harvested and stained with appropriate primary and secondary fluorochrome-conjugated antibodies and then subjected to FACS analysis. There is an apparent biphasic dose effect on the mean expression of the Ia + antigen, suggesting that the dose/concentration of the antioxidant can contribute significantly to altering immune phenotypic marker expression. of common parasubstituted phenolic antioxidants, namely MBEH, BHT, and BHA, appear to alter the density of identifiable Ia+ Langerhans cells in various strains of mice. Further, these alterations in Ia+ Langerhans cells were dose-related and corre- lated with either enhancement or suppression of the contact hypersensitivity response in these mice strains (1). In addition, this effect could be totally reproduced by using a biologically relevant molecule, namely arachidonic acid. However, these earlier in vivo experiments performed in our laboratory were "gross," using the imprecise mouse ear swelling assay, which lacks the precision and sensitivity needed to validate our earlier functional CHS observations. The current studies were carried out using a more precise methodology, that of fluores- cent-activated cell sorting, to determine whether it could serve as a screening technique to determine which of these ubiquitous antioxidants/preservatives may contribute to Figure 1. Changes in Langerhans cell density and Ia expression following topical treatment with MBEH: Increase in density (number) and class II MHC product (Ia antigen) of unenriched murine Langerhans cells following five days of in vivo topical treatment with diluent (a) or MBEH (b). To identify Ia q. Langerhans cells, dual labeling immunofluorescence was performed using fluorescein isothiocyanate (FITC)-labeled anti-Fc receptor and monoclonal anti-class II MHC streptavidin phycoerythrin red (PE) antibodies. In other words, two cell membrane markers were used to identify Langerhans cells from keratinocytes (i.e., the Ia marker and the Fc marker are found only on Langerhans cells in normal epidermis). The percentage of identifiable Iaq, Langerhans cells increased significantly from 1.4% to 3.3% in fluorescent intensity as shown in the histogram, Figures la and lb, respectively. Arrows indicate positive signal gated regions (i.e., FACS is able to detect fluorochrome marker expression). The mean fluorescent intensity (i.e., mea- surement/density of Ia marker) also increased from 69.51% (diluent) to 72.99% (treated). X-axis denotes fluorescent intensity y-axis denotes the number of events.
Purchased for the exclusive use of nofirst nolast (unknown)
From: SCC Media Library & Resource Center (library.scconline.org)