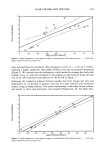
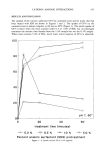
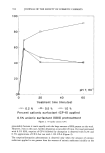
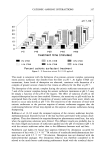
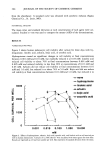
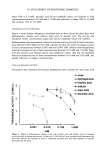
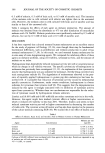
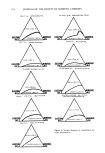
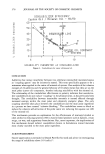
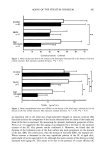
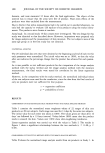
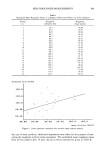
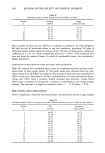
388 JOURNAL OF THE SOCIETY OF COSMETIC CHEMISTS forearm, and were measured 12 hours after the final application. The object of this interval was to ensure that the areas were free of product. Short-term effects of the products were thus excluded from the measurement. Due to the fact that stylus measurements had to be carried out in another laboratory, we only had the capacity to evaluate 120 replicas of six products using the stylus instru- ments. The products were chosen at random. Secondstudy. In a second study 14 skin creams were investigated. The test design for this study was identical to that described above. However, impressions were prepared only for image analysis and the measurement of skin moisture. The test subjects were of the same age group as in the first study but not identical. STATISTICAL ANALYSIS The 20 individual data sets that were obtained at the beginning and end of each test for each parameter were normalized. The initial value was set at 100%, so that the value after use indicates the percentage change that the product has achieved for each param- eter. As it was possible to test sufficient products for the comparison of the image analysis method with the stylus method and the image analysis method with the moisture measurement, the final results were tested for correlation by the linear regression method. However, in the comparison with the stylus method, the normalized individual values of the test subjects were used for the correlation, since the data from the final results of only six products were not sufficient for that purpose. r = regression coefficient p = probability of error RESULTS COMPARISON OF THE METHYLENE BLUE METHOD WITH THE IMAGE ANALYSIS METHOD Table I contains the normalized mean roughness values of 22 ranges of skin care products on 20 test subjects. Each range was used for 14 days by the same test subjects. The initial value for each series was taken as 100%. The values given are those after 14 days' use followed by a 12-hour interval. Values below 100% mean that the product tends to smooth the skin. Values over 100% show skin-roughening tendencies. Linear regression analysis was carried out with the values in Table I. The results in Figure 1 show a significant relationship between the two methods (r = 0.48 p 0.05). COMPARISON OF THE STYLUS METHOD WITH THE IMAGE ANALYSIS METHOD Table II shows the normalized image analysis results from six products in Study 1. In

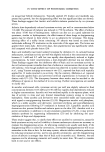
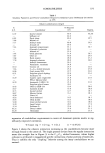
SKIN ROUGHNESS MEASUREMENTS 389 Table I Normalized Mean Roughness Values of 22 Ranges of Skin Care Products on 20 Test Subjects Product Roughness, Roughness, no. methylene blue image analysis ! 78.7 94.86 2 8!.6 92.93 3 84.8 9O.94 4 86.5 93.9! 5 88.3 95.57 6 88.7 95.97 7 90.0 94.70 8 90.0 97.05 9 94.9 97.52 !0 98.0 92.83 11 98.5 92.47 !2 98.7 97.83 !3 !00.6 95.97 14 103.6 97.77 15 104.4 102.54 16 105.3 102.54 17 105.5 97.76 18 !09.3 98.65 19 110.3 102.55 20 !13.5 57.09 21 114.5 94.45 22 122.7 95.9! Methylene blue method 120.0- 110.0- 1oo.o- 90.00 90 I I I I I Image Analysis Method Figure 1. Linear regression: methylene blue method-image analysis method. the case of these products, additional impressions were taken for the purpose of mea- suring the roughness with the stylus equipment. The normalized mean roughness values from 20 test subjects after 14 days' use and 12-hour intervals are given in Table II.
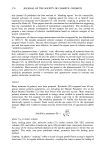
Purchased for the exclusive use of nofirst nolast (unknown)
From: SCC Media Library & Resource Center (library.scconline.org)