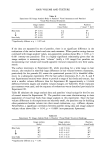
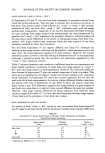
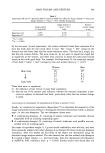
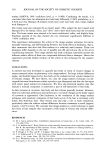
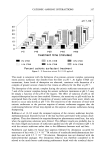
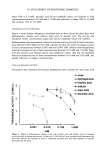
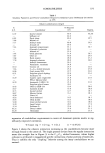
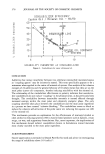
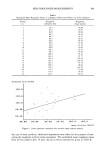
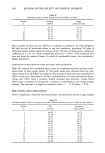
390 JOURNAL OF THE SOCIETY OF COSMETIC CHEMISTS Table II Normalized Image Analysis Results From Six Products in Study 1 Product Scanning Image no. method analysis method 4 92.41 93.91 9 100.18 97.52 12 95.31 97.83 16 95.13 102.54 19 95.19 102.55 20 99.50 97.09 Since six pairs of values are not sufficient to calculate a correlation, we were obliged to fall back on the 20 individual values to test the correlation, providing 120 pairs of individual values. Linear regression analysis of the 120 pairs of values gives a correlation coefficient of r = 0.315, with a probability of error p 0.001. (The individual data were not listed for reasons of space.) In spite of considerable scatter, the correlation is highly significant. COMPARISON OF SKIN MOISTURE WITH THE IMAGE ANALYSIS METHOD Table III contains the normalized mean values for roughness and skin moisture evalu- ations from 14 skin creams (Study 2). The mean values were obtained from the indi- vidual values from 20 female test subjects. The untreated mean value was normalized to 100% in each case. The results of 14 days' use followed by a 12-hour interval are shown. Values over 100% mean a tendency toward increased skin moisture. Values below 100% mean a tendency to drying and a tendency to smoothness in the image analysis method. The outcome is a negative correlation with r = -0.59 and p 0.05. DISCUSSION AND CONCLUSIONS There is significant correlation between all three test procedures and the image analysis Table III Normalized Mean Values for Roughness and Skin Moisture Evaluations From 14 Skin Creams (Study 2) Product Skin Roughness, no. moisture image analysis 1 108.87 86.76 2 107.28 93.38 3 110.97 92.76 4 119.10 89.97 5 100.96 103.33 6 120.47 89.71 7 113.76 94.67 8 111.07 94.84 9 109.76 92.05 10 99.77 76.07 11 107.84 97.25 12 109.66 95.39 13 117.78 90.03 14 112.04 95.54

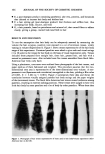
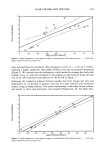
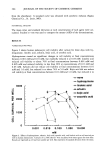
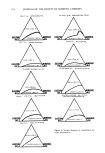
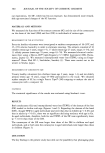
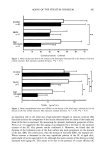
SKIN ROUGHNESS MEASUREMENTS 391 measurement. The correlation with skin moisture again confirms the assumption of Potts (9) and other authors that the water content of the stratum corneum is a significant criterion in influencing skin roughness. The methylene blue method provides a satisfactory correlation with the image analysis method (Figure 1). It confirms that this simple procedure gives usable data on the influence of cosmetics on skin roughness. The results of the correlations between the roughness investigation with the stylus equipment and image analysis are only indicative, because in this case the individual values of the test subjects were correlated. The wide individual variation helps to explain the relatively small r value. Statistical analysis indicates that the methods agree very well for a comparison of products. In Table II, product 4 achieves a significant smoothing effect according to both methods, with p = 0.05 in the t-test. This test determined whether the roughness value found differed from 100. In comparison, all other products did not provide significant results. These investigations support the conclusion that the described image analysis method provides similar results to the profilometry method and is a useful method to determine skin roughness. As image analysis is less time-consuming than the use of stylus instru- ments and the evaluation programs can be acquired on usual image analyzers without programming knowledge, this method is a useful alternative to profilometry. ACKNOWLEDGMENTS We are grateful to the Warentest Foundation, Berlin, for permission to publish data that was prepared by the two authors within the framework of a study of skin care ranges in 1987. REFERENCES (1) P. Corcuffetal., Skin relief and aging, J. Sac. Cosmet. Chem., 34, 177-189 (1983). (2) P. Corcuff et al., A fully automated system to study skin surface patterns, Int. J. Cosmet. Sci., 6, 167-176 (1984). (3) P. Corcuff et al., Evaluation of anti-wrinkle effects on humans, Int. J. Cosmet. Sci., 7, 117-126 (1985). (4) P. Corcuff et al., The impact of aging on the microrelief of periorbital and leg skin, J. Sac. Cosmet. Chem., 38, 145-152 (1987). (5) U. Hoppe, Topology of skin, J. Sac. Cosmet. Chem., 30, 213-239 (1979). (6) T. H. Cook, Profilometry of skin--A useful tool for the substantiation of cosmetic efficacy, J. Sac. Cosmet. Chem., 31, 339-359 (1980). (7) S. Makki et al., Statistical analysis and three-dimensional representation of the human skin surface, J. Sac. Cosmet. Chem., 35, 311-325 (1984). (8) U. Hoppe, G. Sauermann, and R. Lunderstadt, Quantitative analysis of the skin's surface by means of digital signal processing,J. Sac. Cosmet. Chem., 36, 105-123 (1985). (9) R. O. Potts, Stratum corneum hydration: Experimental techniques and interpretation of results, J. Sac. Cosmet. Chem., 37, 9-33 (1986). (10) J. L. Leveque and J. De Rigal, Impedance methods for studying skin moisturization, J. Sac. Cosmet. Chem., 34, 419-428 (1983). (11) G. Padberg, Modifizierte Methylenblau-Methode zur Priifung des Rauhigkeitsgrades der Horn- schicht, J. Sac. Cosmet. Chem., 12, 719-728 (1969).
Purchased for the exclusive use of nofirst nolast (unknown)
From: SCC Media Library & Resource Center (library.scconline.org)