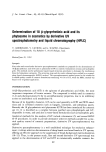
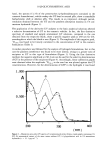
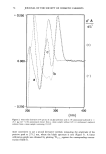
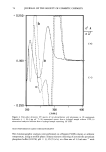
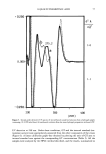
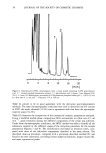
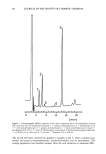
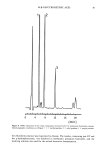
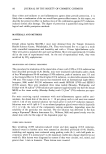
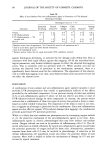
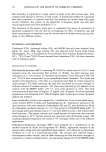
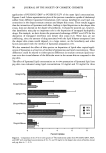
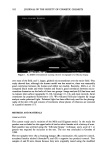
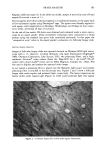
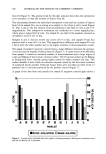
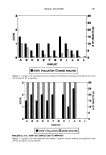
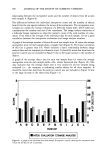
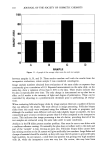
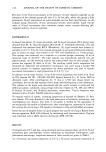
78 JOURNAL OF THE SOCIETY OF COSMETIC CHEMISTS I I I 2 I I I 12 16 20 Figure 6. Representative HPLC chromatogram from a cream sample containing 0.06% glycyrrhetinic acid 1 = internal standard (testosterone acetate) 2 = glycyrrhetinic acid. Column: 5 p•m Hypersil C18, 250 X 4.5 mm I.D. Mobile phase: acetonitrile:0.02 M potassium phosphate buffer (pH = 3.0) 65:35 (v/v) at a flow rate of 1.2 ml min-•. Detection: UV at 248 nm. Table II, proved to be in good agreement with the derivative spectrophotometric methods. The same chromatographic conditions were used to determine the GT content in GTP the result obtained (34.9%) was in agreement with that from the spectropho- tometric assay (34.2%). Table III illustrates the composition of the commercial cosmetic preparations analyzed. Using a modified mobile phase composition (60% acetonitrile) at a flow rate of 1 ml ß --I min , good resolution among the different components of the cream was achieved. Under these chromatographic conditions, the HPLC method was able to identify all the substances isolated in the different stages of the extraction procedure for the sample preparation (Figures 7 and 8). The identification was based on retention times, com- pared with those of the individual components dissolved in the same solvent. The described clean-up procedure, compared with a previously described method (9), was found to be more convenient, providing cleaner analytical solutions, longer column life, and more symmetrical peaks.

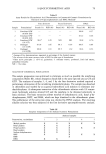
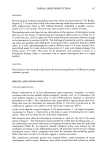
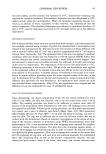
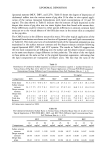
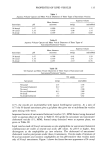
18 [3-GLYCYRRHETINIC ACID 79 Table II Assay Results for Glycyrrhetinic Acid Determination in Commercial Cosmetic Formulations by Derivative UV Spectrophotometric and HPLC Methods a First derivative Second derivative HPLC Sample Formulations c Found (%) RSD (%) Found (%) RSD (%) Found (%) RSD (%) 1 Emulsion O/W .... 100.8 0.57 (0.06% GT) 2 Emulsion O/W .... 101.2 0.44 (0.06% GT) 3 Emulsion O/W 98.3 b 3.29 ND ND 99.8 0.76 (1% GT) 4 Hydrogel 101.8 1.66 99.3 0.93 100.4 0.84 (1% GTP) 5 Hydrogel 100.8 1.91 99.5 1.32 99.6 0.53 (1% GTP) Average of five determinations, expressed as percentage of the claimed content. On account of the mean recovery value of 90% for this type of formulation. Other active principles: 2. olive oil, gaiazulene 5. rosemary extract, panthenol, birch leaf extract, polisorbate biosulfur. ND = Not done. ANALYSES OF COMMERCIAL FORMULATIONS The sample preparation was optimized to eliminate as much as possible the interfering components (Table III), whose absorption bands fall in the same spectral area as GT and GTP. The analyses of samples 3, 4, and 5 by the first derivative method required a preliminary elimination of the interfering imidazolidinylurea. The sample was dissolved in chloroform and washed by an aqueous hydrochloric acid solution to eliminate imi- dazolidinylurea. A subsequent extraction of the chloroformic solution with 1% ammo- nium hydroxyde solution allowed GT and the parabens to be obtained selectively in basic medium. The basic extraction allows removal of dehydroacetic acid, butyl p-hy- droxybenzoate, BHT, and BHA, which are kept dissolved in the chloroformic phase. The performance of the extraction steps was checked by HPLC analysis. The resulting alkaline solution was then subjected to the first derivative spectrophotometric analysis. Table III Excipient Components of the Analyzed Cosmetic Formulations Preservatives, antioxidants Analyzed samples 1 2 3 4 5 Methyl paraben X X X X X Ethyl paraben X X X Propyl paraben X X X X X Butyl paraben X X X Sodium dehydroacetate X X X IMU X X X X BHT X BHA X X
Purchased for the exclusive use of nofirst nolast (unknown)
From: SCC Media Library & Resource Center (library.scconline.org)