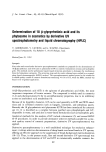
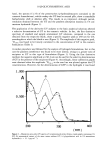
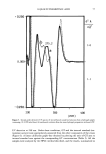
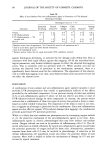
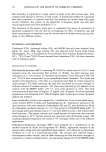
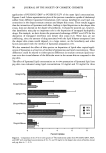
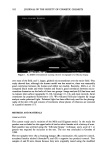
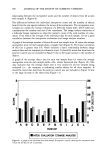
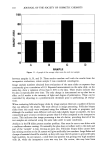
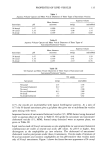
76 JOURNAL OF THE SOCIETY OF COSMETIC CHEMISTS + 0.250- O. 000 - 0.250 - b ß ß ß ß ß ß ß ß ß ß ß ß ß ß ß ß ß ß : ß :. . ß • ß ß ß ß -I I ! ß ! C, i ! /I : I - I : I .... t..I.. I I 300 (nm) I 200 qO0 dlA (+) (-) Figure 4. First-order derivative UV spectra of: (a) glycyrrhetinic acid phytosome in 1% ammonium hydroxide (c = 86.6 Ixg ml-•) (b) ammoniacal extract from a hydrogel sample without GTP (c) ammoniacal analytical solution from a hydrogel sample containing 1% GTP. HIGH PERFORMANCE LIQUID CHROMATOGRAPHY The chromatographic analyses were performed on a Hypersil 50DS column at ambient temperature, using as mobile phase a binary mixture consisting of acetonitrile:potassium phosphate buffer (0.02 M pH = 3), 65:35 (v/v), at a flow rate of 1.2 ml min- • with

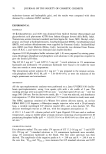
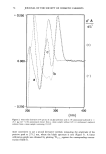
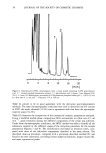
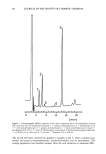
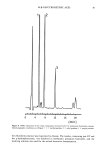
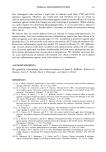
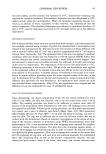
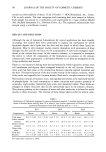
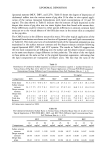
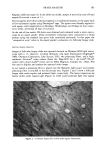
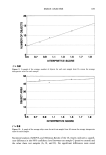
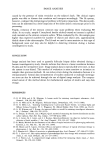
18 •-GLYCYRRHETINIC ACID 77 + 0.250 O. 000- - 0.250 I I I I I 200 300 qO0 (nm) Figure 5. Second-order derivative UV spectra of: (a) methanoJic analytical solution from a hydrogel sample containing 1% GTP (solid line) (b) methanolic solution from the same hydrogel preparation without GTP. UV detection at 248 nm. Under these conditions, GT and the internal standard (tes- tosterone acetate) were appropriately separated from the other components of the cream (Figure 6). A linear calibration graph was obtained by plotting the ratio of GT area to internal standard area against the corresponding GT concentrations (Table I). All the samples were analyzed by the HPLC method described, and the results, summarized in
Purchased for the exclusive use of nofirst nolast (unknown)
From: SCC Media Library & Resource Center (library.scconline.org)