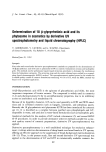
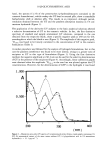
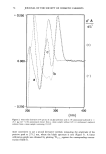
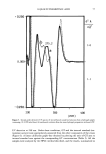
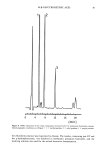
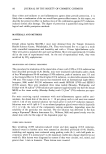
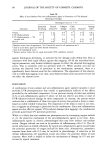
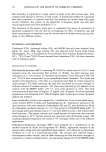
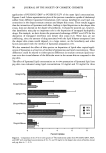
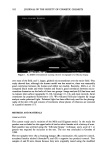
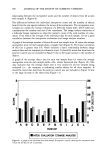
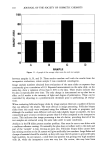
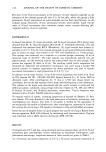
74 JOURNAL OF THE SOCIETY OF COSMETIC CHEMISTS + 0.250 - / ß : 0.000- 0.250 - I I I I I ! I : I I : I I I 200 300 400 (nm) Figure 2. First-order derivative UV spectra of: (a) glycyrrhetinic acid in 1% ammonium hydroxide (c = 21.1 }xg ml-•) (b) ammoniacal extract from a cream sample without GT (c) ammoniacal analytical solution from a cream sample containing 1% GT. more convenient to use a second derivative method, measuring the amplitude of the positive peak at 275.2 nm, where the blank spectrum is zero (Figure 5). A linear calibration graph was obtained by plotting 2D275. 2 against the corresponding concen- tration (Table I).

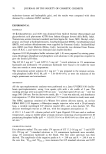
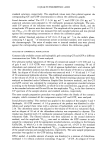
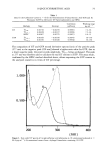
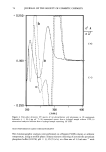
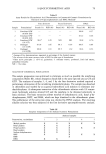
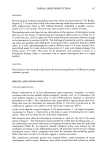
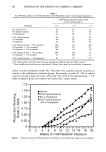
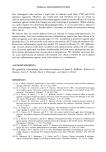
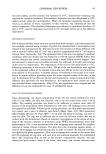
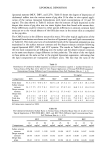
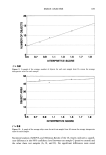
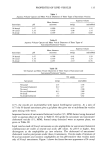
18 I3-GLYCYRRHETINIC ACID 75 Table I Data for the Calibration Curves (n = 6) for the Determination of Glycyrrhetinic Acid (GT) and Its Phytosome (GTP) by Derivative UV Spectrophotometry and HPLC Correlation Working range Methods Slope Intercept coefficient I.tg ml- •' GT 1D248 0.007 10 -- 0.00270 0.99991 7.2-36 2D275.2 0. 00428 -- 0. 00417 0. 99996 7.2-36 HPLC 0. 06407 0. 00725 0. 99873 6.0-15 GTP 1D246.4 0.00169 -- 0.00330 0.99945 30-150 2D275.2 0.00150 -- 0.00320 0.99940 30-150 The comparison of GT and GTP second derivative spectra [ratio of the positive peak (277 nm) to the negative peak (250 nm)] showed a higher ratio value for GTP, due to a lower negative peak, the positive peak amplitude, 2D277, being unchanged. The peak at 277 nm was therefore used to calculate the real GT content in GTP. The assay result, confirmed by the HPLC method described above, allows expressing the GTP content in the analyzed cosmetics in terms of GT percentage. 0.500- eeeee I I I I 200 300 400 (nm) Figure 3. Zero order UV spectra of: (a) glycyrrhetinic acid phytosome in 1% ammonium hydroxide (c = 86.6 p•g ml-1) (b) ammoniacal extract from a hydrogel formulation containing 1% GTP.
Purchased for the exclusive use of nofirst nolast (unknown)
From: SCC Media Library & Resource Center (library.scconline.org)