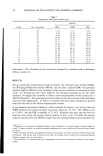
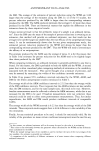
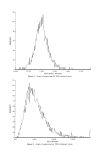
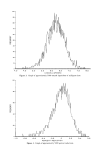
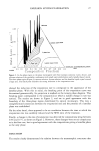
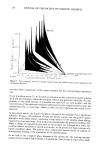
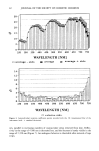
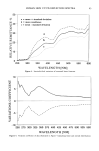
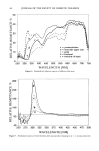
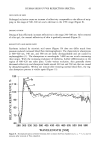
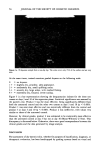
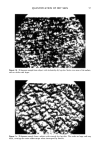
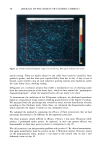
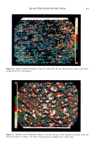
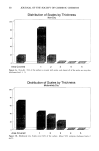
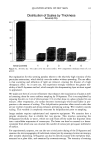
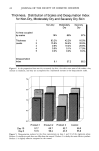
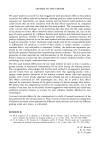
100- go- 80- 70- 60- Z '• ,50- i, 4.0- ,30- 20- 10- 0 4.0 ::::::::::::::::::::::::::::: .............................................. ::: .........................................................::::::::::::::::: 4.5 5.0 5.5 6.0 6.5 7.0 7.5 8.0 LOG(MILLIGRAMS) Figure 3. Graph of approximately 5000 natural logarithms of milligram data. - z i,i i, 100- 80- 60- 4.o' 20. ::::::::::::::::::::::::::::::::::::::::::: .......................................................................... .0 -0.8 -0.6 -0.4 -0.2 0 0.2 0.4- 0.6 PERCENT REDUCTION Figure 4. Graph of approximately 5000 percent reductions.

ANTIPERSPIRANT DATA ANALYSIS method tending to have slightly higher estimates than the direct method. The Wood- ing-Finkelstein method always produces higher estimates of percent reduction than the direct method and almost always produces higher estimates than the adjusted ratio method. These statements are supported by empirical results as well as theoretical considerations. Since the direct method produces statistically unbiased estimates, while the other two methods do not, the direct method is preferred. Also, there is little in the way of increased precision (width of confidence intervals) to recommend one of the three methods over the other two. Other methods of analysis such as analysis of covariance, analysis of log-transformed adjusted ratios, and non-parametric methods have also been used by experimenters to analyze antiperspirant data. Since the first two of these methods use transformed data, they will provide biased estimators, as the Wooding-Finkelstein method does. Although a non-parametric technique might be valid, it is well known that non-parametric methods are less powerful than parametric methods. Thus the direct method would be preferred. Finally, we want to emphasize that the results of this paper are in reference to experi- ments in which the objective is to estimate the percent reduction of an antiperspirant. For studies with other objectives, such as testing which of two or more antiperspirants has the greater (or greatest) efficacy, it is as yet to be determined what, if any, statistical analysis is most appropriate. ACKNOWLEDGMENTS The authors gratefully acknowledge Cindy Yablok and Sally Burkhard for their assis- tance in the preparation of this manuscript. REFERENCES (1) W. G. Fredall and R. R. Read, Antiperspirant-axillary method of determining effectiveness, Proc, Sci. Sect., Toilet Goo& Assoc., 15, 23-27 (1951). (2) W. M. Wooding et al., Statistical evaluation of quantitative anriperspiranr data. I., J. Soc. Cosmet. Chem., 15, 579-592 (1964). (3) F. B. Carabello, Guidelines for the clinical study of antiperspirant and deodorant efficacy, Cosmet. Toilerr., 95, 33 (1980). (4) P. A. Majors and John E. Wild, The evaluation of anriperspirant efficacy--Influence of certain variables, J. Soc. Cosmet. Chem., 25, 139-152 (1974). (5) W. M. Wooding and P. Finklestein, A critical comparison of two procedures for antiperspirant evaluation, J. Soc. Cosmet. Chem., 26, 255-275 (1974). (6) ASTM Committee E-18, "Standard Practice for the Sensory Evaluation of Axillary Deodorancy," in Annual Book of ASTM Standards, Vol. 15.07 (1988).
Purchased for the exclusive use of nofirst nolast (unknown)
From: SCC Media Library & Resource Center (library.scconline.org)