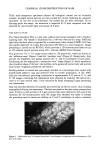
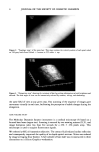
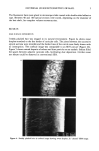
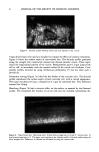
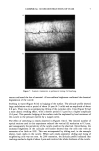
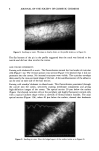
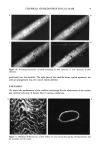
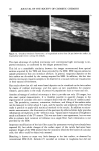
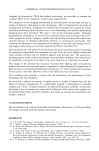
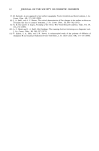
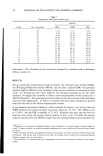
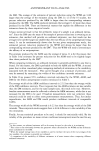
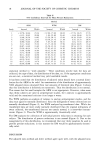
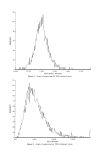
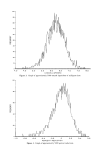
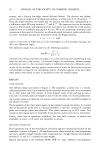
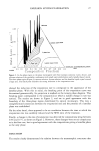
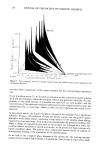
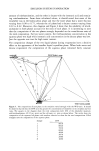
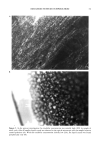
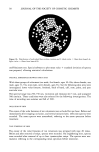
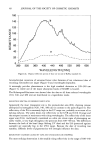
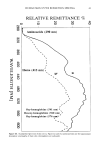
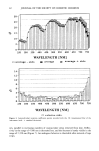
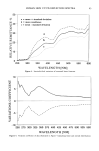
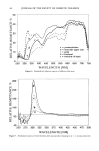
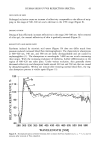
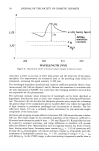
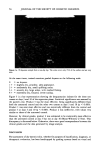
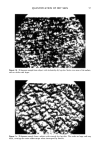
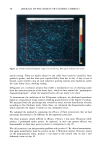
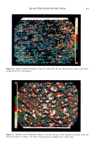
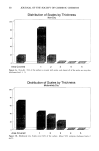
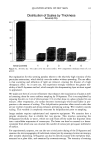
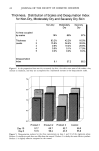
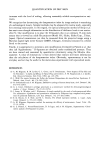
18 JOURNAL OF THE SOCIETY OF COSMETIC CHEMISTS Table II 95% Confidence Intervals for Mean Percent Reductions Method ARM WFM DM Study Interval Width Interval Width Interval Width 1 - 12.78 2 -0.35 3 12.48 4 13.62 5 10.80 6 15.11 7 20.87 8 25.58 9 33.94 10 35.72 11 38.11 12 39.83 13 44.19 14 49.17 15 50.96 10.46 23.24 - 12.96 19.65 20.00 1.94 26.50 14.02 12.29 26.34 12.72 10.38 34.64 23.84 5.05. 30.43 15.32 13.37 34.49 13.62 23.58 40.34 14.76 27.85. 49.98 16.04 40.32 48.38 12.66 34.43 49.01 10.90 37.83 50.73 10.90 40.19. 56.41 12.22 50.47. 63.93 14.76 45.97 68.88 17.92 56.04. 17.06 30.02 - 17.55, 10.21 27.76 25.60 23.66 -3.04, 20.66 23.70 28.13 15.84 10.39, 25.69 15.30 27.76 17.38 6.57, 25.33 18.76 35.46 30.41 4.81, 33.51 28.70 29.36 15.99 10.63, 26.05 15.42 35.24 11.66 20.54, 32.74 12.20 42.35 14.50 24.60, 39.88 15.28 55.90 15.58 35.38, 53.22 17.84 50.32 15.89 30.29, 47.55 17.26 52.61 14.78 36.13, 49.17 13.04 53.27 13.08 37.24, 50.74 13.50 59.89 9.42 48.48, 58.14 9.66 67.51 21.54 44.04, 64.30 20.26 73.65 17.61 51.47, 73.51 22.04 statistical method to "work properly." These conditions involve how the data are collected, the type of data, the distribution of the data, etc. If the appropriate conditions are not met, a statistical method may yield unreliable results. It has been noted that the distribution of adjusted ratios should have a normal distri- bution for the ARM to be valid. An examination of the distribution of approximately 5000 adjusted ratios calculated from vast amounts of historical data (Figure 1) shows that this distribution is definitely not symmetric. Thus the distribution is not normal. This means that for small samples the ARM is not appropriate. However, when more than thirty subjects are used in antiperspirant studies, the t-statistic is approximately valid and the mentioned criticism is no longer a worry. The WFM performs an analysis of variance to analyze antiperspirant studies, and the data must again be normally distributed. Since the milligrams of sweat collected are not normally distributed (Figure 2), the WFM analyzes log-transformed data. While the transformed data are more nearly normally distributed than the original milligrams of sweat collected, the transformed data are not exactly normal it is somewhat nonsym- metric (Figure 3). Thus the WFM is approximately theoretically valid. The DM analyzes the collection of individual percent reductions in sweating for each subject. The distribution of percent reductions is not normal (Figure 4). Due to the nonsymmetry of this distribution, we recommend that over thirty panelists be used to provide percent reductions in this manner the DM would be approximately theoreti- cally valid. DISCUSSION The adjusted ratio method and direct method agree quite well, with the adjusted ratio

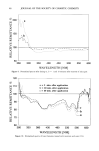
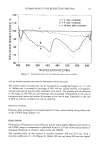
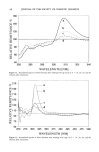
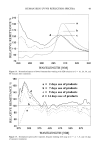
z 120- 0.50 11o 0.75 1.00 I .25 I .50 ADJUSTED RATIOS Figure l. Graph of approximately 5000 adjusted ratios. I .75 lOO 4-0- 30- 20- lO- 54-0 1000 1500 MILLIGRAMS Figure 2. Graph of approximately 5000 milligram values.
Purchased for the exclusive use of nofirst nolast (unknown)
From: SCC Media Library & Resource Center (library.scconline.org)