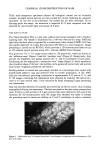
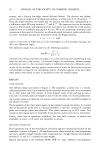
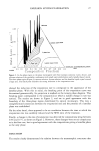
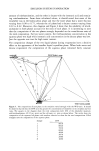
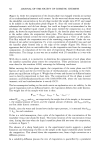
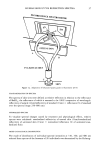
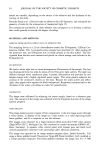
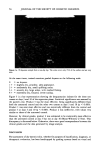
EMULSION SYSTEM EVAPORATION 29 amount of triethanolamine, and the other is decane with the isostearic acid and remain- ing triethanolamine. From these calculated values, it should noted that most of the emulsifier was in the hydrocarbon phase and that the water phase had a water fraction varying from 0.98 to 0.75, whereas the oil phase had a decane content varying from 0.92 to 0.42. Moreover, this diagram and Figure 4 show that the solubility of trieth- anolamine in both phases accounts for the ratio of each phase. It is interesting to note that the composition of the two phases strongly depended on the water/decane ratio of the total composition. For low water content, the triethanolamine concentration in the aqueous phase was high while isostearic acid concentration in the decane phase was low. Just the opposite was true for high water content. The composition changes of the two liquid phases during evaporation have a decisive effect on the appearance of the lameliar liquid crystalline phase. When both water and decane evaporated, the composition of the aqueous phase remained fairly constant DEC 1808TEARIC ACID 5 6 3• :R TRIETHANOLAMINE Figure 4. The composition of each phase in the emulsion varied strongly with the W/O ratio. It should be observed that the less the O/W ratio the greater the concentration of emulsifier in the oil phase and vice versa. The squares in the diagram show the total composition with 10% of the emulsifier (isostearic acid/triethanolamine, 65/35 wt. ratio) and the oil/water wt. ratio as shown below. The circles show the composition of the separated oil phase with numbers identical to those for the total compositions. Filled triangles note the composition of the aqueous phase. Sample 1 2 3 4 5 6 7 8 O/W 90/10 80/20 7O/3O 6O/4O 4O/6O 30/70 20/80 10/90

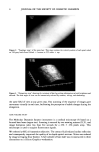
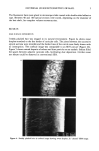
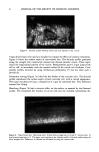
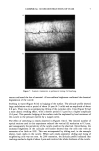
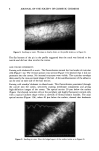
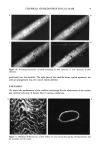
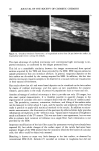
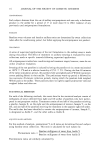
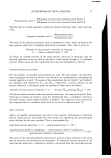
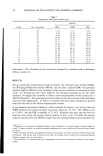
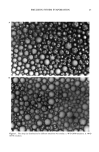
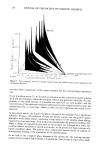
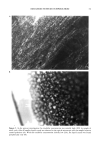
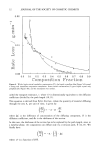
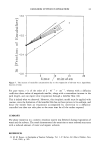
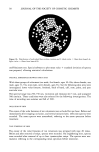
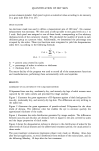
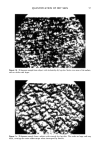
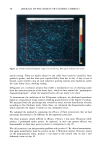
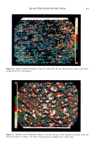
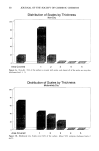
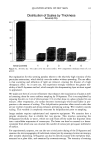
30 JOURNAL OF THE SOCIETY OF COSMETIC CHEMISTS (Figure 4), while the composition of the decane phase was changed towards an increase of its triethanolamine/isostearic acid content. As the water and decane were evaporated, the emulsifier concentration in the oil phase reached the weight ratio 65/35 and ceased to be soluble in the hydrocarbon phase (Figure 4). Since the total amount of trietha- nolamine/isostearic acid did not change, but could no longer be accommodated in the oil phase, the lameIlar liquid crystal at this point entered the composition as a third phase. As shown by experimental results (Figure 5), the lamellar phase was thus formed at the surface where the evaporation takes place. The observation revealed that the lamellar phase formed covered the entire sample, appearing as a "film" at the surface. This film reduced the evaporation rate of the remaining composition. Under the con- ditions of our earlier investigations (7), a low concentration of emulsifier was used and the lamellar phase formed only at the edge of the sample (Figure 5B). Hence its appearance had de facto no noticeable effect on the evaporation rate from the remaining composition. A comparison of the two rates of evaporation (Figure 6) illustrates these observations. The change in rate was not as marked with 2% emulsifier as it was with 10%. With this in mind, it is instructive to determine the composition of each phase when the lameliar crystalline phase enters the composition. These preliminary calculations were done for the emulsion 40/60, assuming the following conditions' Before entering the three-phase region, the composition of the water phase was 0.98 fraction of water and the rest 0.02 fraction of triethanolamine, according to the three- phase area equilibrium in Figure 4. Weight loss of water and decane (no diffusion barrier case) is directly proportional to their ratio. The composition of the oil phase is water/ isostearic acid/triethanolamine/decane (0/0. 103/0.054/0.838, where the ratio between isostearic acid and triethanolamine is exactly 65/35. The last assumption leading to this result merits an explanation as to its validity. In the case of evaporation with no diffusion barrier, the evaporation follows first order kinetics. The weight loss of the sample with time is then: Wlos s -- (kH20 WH20 -•- kde c ' Wdec) ' t where Wloss, WH20, and Wae c are respectively the weight loss of the sample, at the instant t, the original amount of water, and the original amount of decane, and kH2 o and kde c are first order kinetic constants. Finally, since the water and decane have similar vapor pressure, it is assumed that kH, o • kde c for each emulsion. If this is a valid assumption, then a plot of the logarithm of the concentration of the emulsifier versus time should be linear. This linear variation of the concentration versus time, during the time when the liquid crystalline phase did not enter the composition, is shown in Figure 7. The absence of a sharp break-point in the experimental results suggests a gradual formation and thickening of a film on the sample as the liquid crystalline phase entered the composition. This slowed down the evaporation rate, from a high convection to a diffusion process. In a solubility-diffusion process the rate of evaporation is quantified by a parameter
Purchased for the exclusive use of nofirst nolast (unknown)
From: SCC Media Library & Resource Center (library.scconline.org)