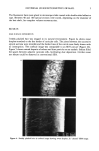
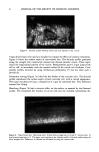
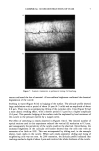
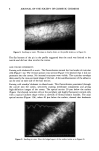
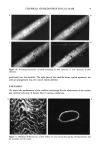
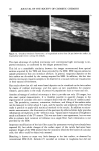
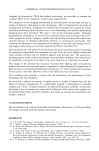
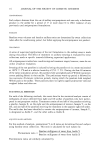
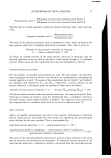
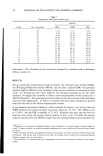
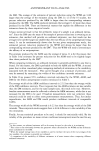
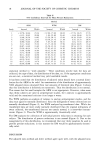
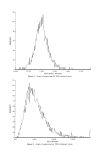
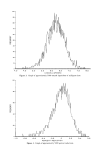
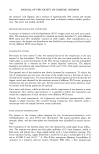
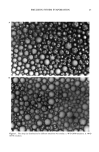
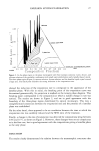
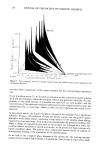
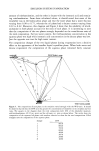
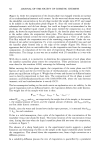
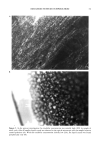
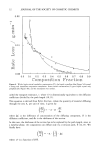
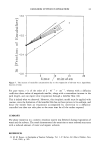
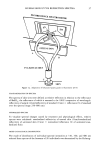
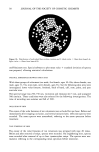
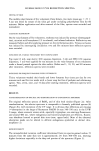
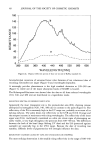
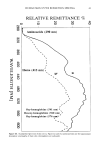
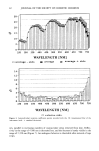
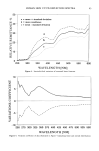
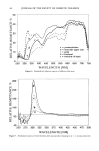
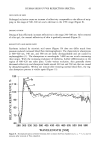
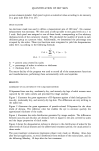
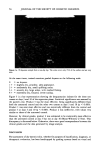
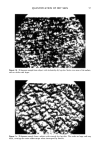
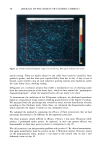
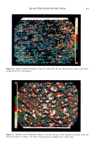
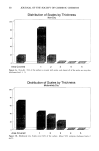
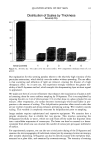
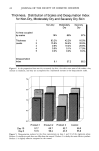
QUANTIFICATION OF DRY SKIN 55 picture elements (pixels). Each pixel is given a numerical value according to its intensity on a gray scale from 0 to 255. IMAGE ANALYSIS An electronic mask was used to define a measurement area of 200 mm 3. No contrast enhancement was necessary. We then used a look-up table to rate gray levels on a 1 to 5 scale. Each pixel was assigned to one of these levels, corresponding to five arbitrary thickness levels of the corneocyte clusters. We calculated the number of pixels in each thickness group as a percent value. Additionally, we determined the percentage area occupied by the scales. These two functions were integrated to yield the desquamation index (D.I.) according to the following formula: 5 2A + Z Tn X (n - 1) n=l D.I. = 6 A = percent area covered by scales. T n = percentage of scales in relation to thickness. n = thickness level (1-5). The macro-facility of the program was used to record all of the measurement functions and transformations, performing these automatically with one keystroke. RESULTS ASSESSMENT OF LEG DRYNESS BY THE D-SQUAMES METHOD D-Squames from non-dry, moderately dry, and severely dry legs of adult women were captured by the video camera and processed by image analysis. Figure I illustrates the gross appearance of D-Squames against a black background for non-dry, moderately dry, and severely dry leg skin. The differences are very striking to the naked eye. Figure 2 illustrates the gross appearance of pseudo-colored D-Squames for the three levels of dryness. The reference color bar enables the eye to estimate quickly the approximate thickness of the scales. Figure 3 illustrates the scale distribution generated by image analysis. The differences between non-dry and dry skin are dramatic both in regard to the area covered by scales and the larger proportion of thick scales. Figure 4 shows the desquamation indexes in relation to the distribution of scales for the three levels of clinical dryness and the abbreviated treatment period the usual period is three weeks. The post-treatment evaluations (regression phase) were made on Monday, three days after the last application, to avoid interference from residues of the moisturizers, and on the following Monday, 10 days after the last treatment.

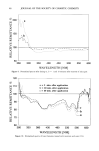
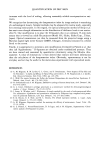
56 JOURNAL OF THE SOCIETY OF COSMETIC CHEMISTS ß w. Figure la. D-Squames sample from a non-dry leg. The scales cover only 15% of the surface and are very thin. At the same times, trained monitors graded dryness on the following scale: 0 = no dryness. 1 + = slightly dry, powdery, ashy appearance. 2 + = moderately dry, small uplifting scales. 3 + = severely dry, large scales, with marked flaking. 4 + = extremely dry, fissured, severe scaling. Figure 5 is a bar representation showing the desquamation indexes for the three test creams at days 3 and 10 of the regression phase. Statistical significance was assessed by the paired t-test. Product 3 was the most effective, being significantly different from both the untreated control and the other two creams at days 3 and 10 (p 0.005). Product 1 was next most effective and was statistically different from the control and product 3 at days 3 and 10 (p 0.005). Product 2 was ineffective, with values very similar to those of the untreated control. However, by clinical grades, product 2 was estimated to be statistically more effective than the untreated control at day 3 but not at day 10 (Mann-Whitney U Test). This discrepancy is discussed below. Otherwise, there was a good correspondence between the clinical grades and the data generated by image analysis. DISCUSSION The assessment of dry (xerotic) skin, whether for purposes of classification, diagnosis, or therapeutic evaluation, has been handicapped by grading systems based on visual and
Purchased for the exclusive use of nofirst nolast (unknown)
From: SCC Media Library & Resource Center (library.scconline.org)