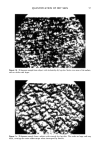
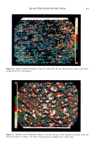
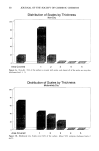
j. Soc. Cosmet. Chem., 44, 53-63 (January/February 1993) Quantification of dry (xerotic) skin by image analysis of scales removed by adhesive discs (D-Squarnes) HARALD SCHATZ, ALBERT M. KLIGMAN, SCOTT MANNING, and TRACY STOUDEMAYER, University of Pennsylvania School of Medicine, Department of Dermatology, Philadelphia, PA 19104-6142 (H.S., A.M.K.), and Biosearch Inc., 3408-50 "B" Street, Philadelphia, PA 19134 (S.M., T.S.). Received June 28, 1992. Synopsis Clinical grading of dry (xerotic) skin is unreliable, being influenced by several variables, especially ambient humidity. We utilized commercially available adhesive-coated discs (D-Squames) to sample the outer portion of the stratum corneum. A procedure was then developed using image analysis to quantify the degree of scaling, using two parameters: 1) the percentage area covered by scales and 2) the distribution of scales accoMing to five thickness levels. There two values were mathematically integrated into one final value, the desquamation index. We showed that image analysis accurately distinguished the intensity of scaling among individuals whose legs were, respectively, non-dry, moderately dry, and severely dry. The method was especially valuable for quantifying the differing efficacies of three moisturizers evaluated by the regression procedure. INTRODUCTION The subjective assessment of dry xerotic skin by sight and touch is fraught with errors. Grading is strongly influenced by ambient meteorological conditions. For example, in Philadelphia, Pennsylvania, one day of wet, warm weather in winter hydrates the surface and sharply reduces the signs of dry skin, though no real change to the desquamating portion of the horny layer has occurred. The limitations of subjective grading are numerous, well known, and a source of frustration to clinicians and manufacturers of moisturizing products (1). Collecting corneocytes on adhesive tape is one approach toward an objective assessment of scaly, rough, xerotic skin. The stripping technique was first described by Wolf over 50 years ago but has never come into fashion (2). Later, workers in our laboratory utilized adhesive-coated glass slides (sticky slides) to obtain a sample of the loose desquamating portion of the outer horny layer (3,4). When appropriately stained, scales, which are really clumps of corneocytes, develop an intense color. However, the 53

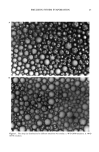
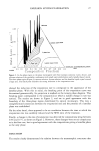
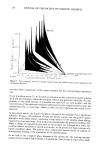
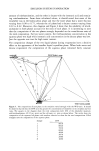
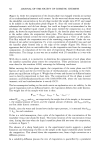
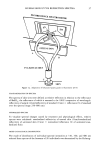
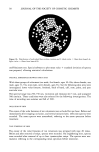
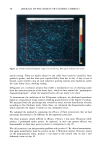
54 JOURNAL OF THE SOCIETY OF COSMETIC CHEMISTS results are variable, depending on the nature of the adhesive and the thickness of the coating on the slide. Recently Serup et al. collected scales on adhesive discs (D-Squames), and estimated the quantity of scales by the attenuation of transmitted light (5). The commercial availability of these adhesive discs prompted us to develop a method that could quantify accurately the degree of scaling. MATERIALS AND METHODS SAMPLING DESQUAMATING HORNY CELLS ON ADHESIVE DISCS The sampling device is a 22-cm clear-adhesive-coated disc (D-Squames, CuDerm Cor- poration, Dallas, TX). Its properties have already been described (5). After peeling off the protective seal, the D-Squames disc is briefly pressed to the skin surface. The disc is peeled from the skin with tweezers and placed on a black storage card included in the D-Squames kit. ILLUMINATION We built a white light box to insure homogeneous illumination of the sample. The box was illuminated from two sides by means of two fiber-optic light carriers. The light was diffused through white translucent glass. Constant illumination was provided by two halogen lamps with a highly regulated power supply. This setup greatly enhances the contrast of the corneocyte clusters on the discs. Because the scales scatter and reflect light, they appear white against the black background. Brightness is proportional to the thickness of the scales, providing an index for quantification. CALIBRATION The lamps were calibrated by adjusting the power supply, based on a reference gray card. The intensity of the image was evaluated with the histogram function of the image analysis program. VIDEO IMAGING The image analysis system consists of four components: 1) the live image source through a video camera, 2) display of the image on a video screen, 3) a video digitizing board frame grabber, and 4) a computer to run the software. The images were obtained by a high-resolution black-and-white CCD video camera (Dage-MTI CCD72, Michigan City, IN) connected to a stereo-microscope (OPMI 1-FC, Zeiss, Germany). A separate video control panel with manual gain and black level controls guaranteed consistent video processing under identical conditions. The image was captured by an image analysis program (Java, Jandel Scientific, CA) using a frame grabber board (Truesvision Targa-M8 Frame Grabber), both installed in a Unisys personal computer. The frame grabber translates the image into 512 X 480
Purchased for the exclusive use of nofirst nolast (unknown)
From: SCC Media Library & Resource Center (library.scconline.org)