ANALYSIS OF COSMETIC INGREDIENTS 333 Table II Limits of Detection for 30 Cosmetic Ingredients in Positive- and Negative-Ion Modes Pos Neg 5 ng 50 ng 500 ng n.d. (500 ng)* 5 ng 50 ng 500 ng (500 ng) 13 10, 11 12 3, 8, 17, 21, 23, 26 7 1, 4 5, 24, 25 2, 6, 9 15 14 16, 18, 19, 20, 22, 27, 28, 29 Limits of detection were established by injecting various amounts of samples (see Experimental). Chemical names corresponding to the numbers in this table are given in Table I. 30, Positive: 5 ng negative ( ):500 ng. * Could not be detected by 500-ng injection. RESULTS AND DISCUSSION APPLICABILITY OF CF-FAB TO COSMETIC ANALYSIS Table II shows the limits of detection obtained in positive- and negative-ion modes. Amino acids [23-25] and p-hydroxybenzoic acid esters [8, 10, 11, 13] showed low detection limits in both modes, while anionic compounds such as phenol [9] and sulfonic acid [7] showed low detection limits only in the negative-ion mode, since they produce a stable ion after releasing proton. Eight ingredients [16, 18, 19, 20, 22, 27-29], most of which were non-polar, could not be detected within a practical sen- sitivity limit of 500 ng. The highest sensitivity obtained was 5 pg for pantothenyleth- ylether [30] in the positive-ion mode. OPTIMIZATION OF METHANOL CONCENTRATION AT THE ION SOURCE The relationship between sensitivity and methanol concentration at the ion source was studied. The matrix solution was added post-column so that we could change the Table III Methanol Content in the Mobile Phase, Matrix Solution, and Mixed Solution Methanol in mobile phase (%) [100 Ixl/min] Methanol in matrix solution (%) [50 Ixl/min (15% glycerin)] Methanol in mixed solution at the ion source (%) 20 50 80 0 20 50 100 0 25 50 100 0 50 80 100 13 20 3O 47 33 42 5O 67 53 7O 8O 87

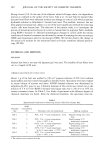
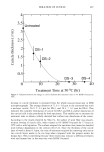
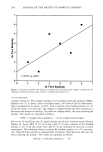
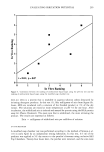
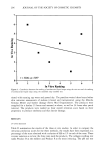
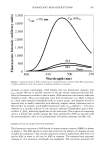
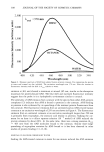
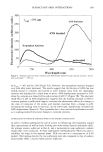
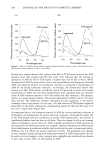
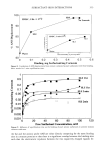
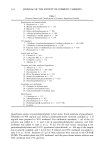
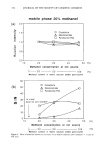
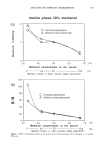
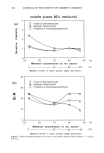
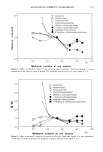
334 JOURNAL OF THE SOCIETY OF COSMETIC CHEMISTS (a) 2.0 1.5 1.0 0.5 0.0 10 mobile phase 20% methanol O Creatinine A Nicotinamide [-'1 Pyridoxine-HCl I ' I 20 30 40 50 (%) Methanol concentration at ion source I I I I 0 20 50 100 (%) Methanol content in matrix solution added post-column (b) 6O 5O 4O 3O 2O 10 0 10 50 (%) 0 Creatinine /% NicotinamiPyridoxine-HCI I-'1 no si y unstabl[•••• • gnal basel line ver 2O 30 4O Methanol concentration at ion source • I I I 0 -- 2o 5o 100 (%) Methanol content in matrix solution added post-column Figure 2. Effect of methanol content at ion source on (a) relative intensity (20% methanol = 1) and (b) S/N ratio.
Purchased for the exclusive use of nofirst nolast (unknown)
From: SCC Media Library & Resource Center (library.scconline.org)