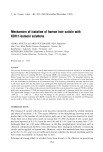
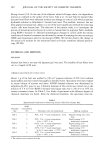
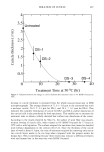
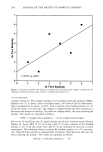
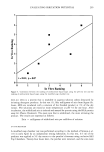
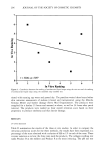
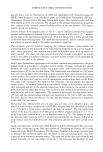
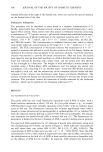
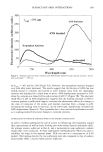
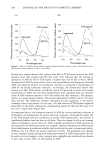
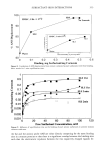
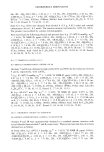
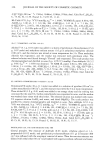
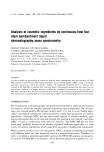
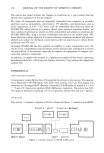
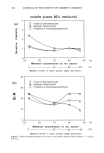
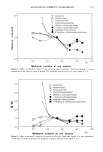
ANALYSIS OF COSMETIC INGREDIENTS 337 2.0 0.0 O Creatinine A Nicotinamide [] Pyridoxine-HCI + Pantothenylethylether x Methyl p-hydroxybenzoate ß n-butyl p-hydroxybenzoate ß _me_th heno one ] i i i 0 20 40 60 80 1 )0 (%) Methanol content at ion source Figure 5. Effect of methanol content at ion source on relative intensity. Data from Figures 2-4 were normalized on the basis of values at around 50% methanol content at the ion source taken as 1.0. 5.0 4.0 Z 3.0 • 2.0 O Creatinine A Nicotinamide [] Pyridoxine-HCI + Pantothenylethylether x Methyl p-hydroxybenzoate ß n-butyl p-hydroxybenzoate ß Isopropyl methyl phenol ß 2-Hydroxy-4-methoxybenzophenone 1.0 0.0 , , , 0 20 40 60 80 100 Methanol content at ion source (%) Figure 6. Effect of methanol content at ion source on SIN ratio. Data from Figures 2-4 were normalized on the basis of values at around 50% methanol content at the ion source taken as 1.0.

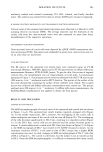
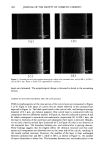
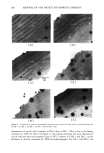
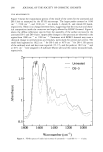
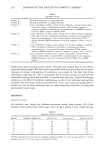
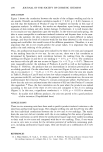
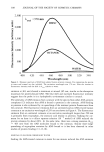
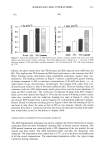
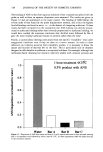
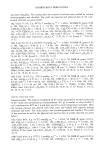
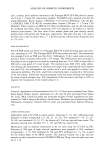
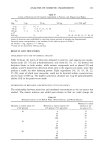
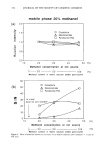
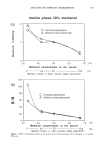
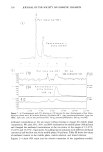
338 JOURNAL OF THE SOCIETY OF COSMETIC CHEMISTS Pyr i dox i ne--HC I ¸ • Pantotheny I -- e r o •1 • • o0 L ...... L_ _ _L_ _L ....... L _ _ L ....... (b) Pyr i dox i ne--HC I 50 ng m/z' 1 ß ß ß •E+g4 •' ß 70 ,• • same as detect,on I,m,t F5.65s m/z •E+06 234 s• ethyl ether •9 200 ng F, 199 , 207 89 ' ' i ' I ' ' I ' ' ' I ' ' ' I ' ' ' 2:99 4:99 6:99 s: ee 19:99 12:99 Figure 7. (a) Chromatogram with UV detection at 2 i0 nm and (b) mass chromatogram of hair lotion. Injection volume was 2 }xl (without dilution). (Pyridoxine-HCl: 1 }xg pantothenylethylether: 4 ptg into HPLC. Split ratio 1:20, so that pyridoxine-HCl: 50 ng pantothenylethylether: 200 ng into MS). methanol concentration at the ion source without having to change the mobile phase composition. We used 20%, 50%, and 80% methanol as the mobile phase (100 •l/min) and changed the methanol concentration at the ion source in the ranges of 13-47%, 33-67% and 53-87%, respectively, by adding matrix solutions with different methanol contents at half the flow rate of the mobile phase (50 •l/min). Table III shows the values of methanol content in the mobile phase, matrix solution, and mixed solution. Figures 2-4 show S/N ratios and the relative intensities of the ingredients studied,
Purchased for the exclusive use of nofirst nolast (unknown)
From: SCC Media Library & Resource Center (library.scconline.org)