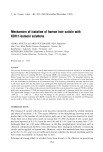
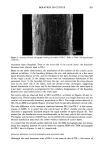
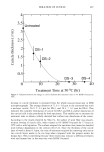
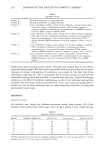
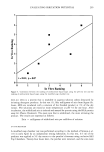
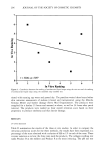
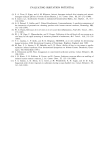
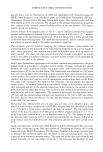
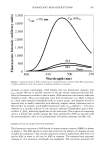
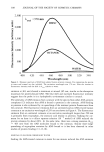
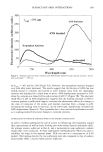
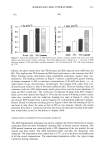
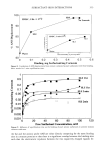
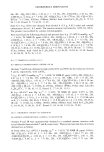
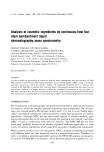
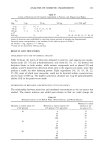
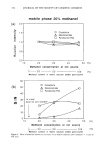
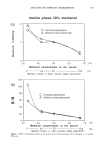
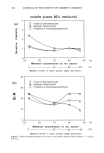
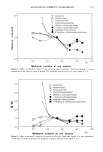
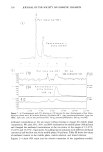
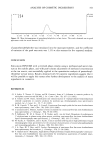
ANALYSIS OF COSMETIC INGREDIENTS 339 C H3C H20• H•C H•C H2N H•C CH• I OCHCCti•OH / OH OH3 C•H•304N = 233 lo0 234 3 •E+06 80' 60- 40- 20- 04.1 0 • •00 266.2 150 250 300 188.1 200 218.3 Figure 8. Mass spectrum of the 6.7-min (m/z: 234) peak assigned to pantothenylethylether. calculated on an intensity value of 1.0 when the methanol concentration at the ion source was the same as that of the mobile phase. With the 20% methanol mobile phase, the relative intensity remained almost unchanged, but the S/N ratio improved with the increase of post-column methanol content (Figure 2). When the solvent of the matrix solution was water (13% methanol at the ion source), the baseline was very unstable and no peaks could be detected. The 50% methanol mobile phase gave higher intensity and better S/N ratio at lower content of methanol in the matrix solution (Figure 3). In the case of the 80% methanol mobile phase, there was no clear change in intensity or S/N ratio with change in methanol concentration at the ion source (Figure 4). When the results of the three independent experiments using different compounds were normal- ized as shown in Figures 5 and 6 with respect to the sensitivity and S/N ratio at around 50% methanol concentration at the ion source (actually 47%, 50%, and 53% for the 20%, 50%, and 80% methanol mobile phases, respectively see Table III), the sensi- tivity showed a tendency to decrease with an increase of methanol concentration, show- ing a steep drop at concentrations higher than 50%. As described earlier, the S/N ratio was not good at concentrations lower than 30%, but seemed to be constant or to improve at higher concentrations. QUANTITATIVE ANALYSIS OF PANTOTHENYLETHYLETHER IN HAIR LOTION Pyridoxine hydrochloride, which was compounded at almost the same level as panto-

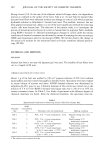
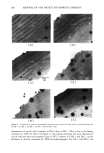
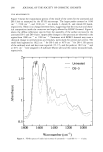
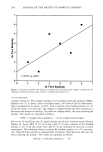
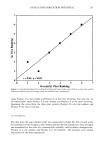
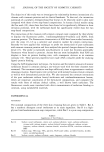
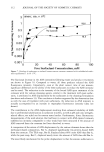
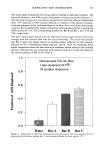
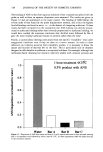
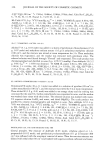
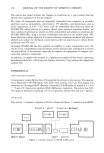
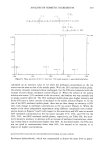
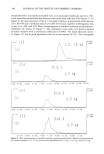
340 JOURNAL OF THE SOCIETY OF COSMETIC CHEMISTS thenylethylether, was hardly detectable even at its protonated molecular ion (m/z 170), while pantothenylethylether was detected with more than sufficient S/N (Figure 7). In Figure 8, the mass spectrum of the 6.7 min peak is shown. A protonated molecular ion (234, M + H) and a methanol adduct ion (266) were found, together with fragment ions at m/z 104, 188, and 218. Mass chromatograms of standard solutions of pantothenyl- ethylether are shown in Figure 9. The calibration curve (data not shown) showed excellent linearity with a correlation coefficient of 0.9993. The result obtained, shown in Figure 10, was in good agreement with the actual amount (0.2%). Two nanograms m/z: •..800 ng Std, 1 1,0 ng •E+06 i: 88 5:30 6: oo 6:30 7:88 7:38 8:88 8:38 9: oo Std, 2 2,0 ng 9:30 i0:88 •E+06 .00• :8{) 5:30 6:{)0 6: 3{) 7: 8{) 7:38 8:{)8 8:38 9: 8{) 9:30 -2. 888 (d,) / ng ' •' '1 ' • '' ' I ' ' ' ' ' I ' '""' I •'1 ' I ' ' ' ' ' I ' I ' I ' 5: 30 6: 00 6: 30 7: 08 7: 38 8: 00 8: 30 9: 80 9: 30 Figure 9. Mass chromatograms of standard solutions of pantothenylethylether. Methyl p-hydroxybenzoate (a) (internal standard, I.S.), 10 ng and pantothenylethylether (b) 1.0 ng, (c) 2.0 ng, and (d) 4.0 ng.
Purchased for the exclusive use of nofirst nolast (unknown)
From: SCC Media Library & Resource Center (library.scconline.org)