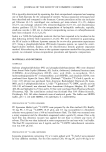
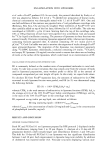
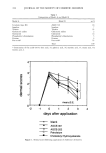
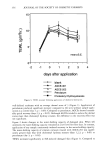
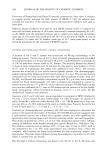
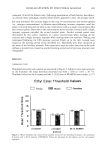
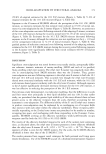
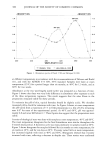
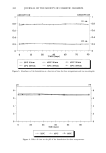
CROSS-ADAPTATION BY STRUCTURAL ANALOGS 369 contained 10 ml of the diluent only. Following presentation of both bottles, the subject, in a forced-choice paradigm, reported which bottle appeared to have the stronger smell. For each threshold, the staircase began at the step-10 concentration and moved upward (i.e., stronger concentrations), in dilution steps following incorrect responses, until the subject correctly detected the odor in two consecutive trials at a single concentration (the first reversal point). Direction in the concentration series was then reversed until a single incorrect response provided the second reversal point. Further reversal points were determined by two correct responses at a given concentration when moving up the staircase and a single incorrect response when moving down the staircase. Testing was terminated following the fifth staircase reversal. Trials up to the first reversal were treated as the learning period of the threshold test. Thresholds were thus calculated as the mean of the last four reversals. Five consecutive steps in either direction on the scale without a reversal were treated as another learning period and all previous reversals were disregarded. RESULTS THRESHOLD TESTS Threshold values for each odorant are presented in Figure 2. Subjects were most sensitive to the Z-isomer the mean detection threshold was 9.00 _+ 0.60 or 3.051 x Threshold values for the E-isomer and the 3:1 E:Z ratio of EE3M2H were similar, 12.75 Ethyl Ester Threshold Values [-----I Group '•-• Males • Females 24 16 e 12 8 m 4 0 E-EE3M2H Z-EE3M2H 3E:IZ EE3M2H Stimulus Figure 2. Mean threshold step values (with standard errors) for the individual E-isomer, the individual Z-isomer, and a 3E:iZ mixture of EE3M2H. Values are presented for all subjects and for each gender separately.

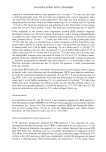
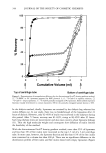
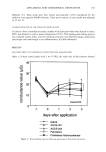
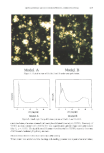
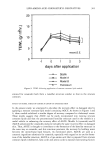
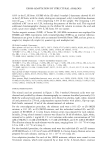
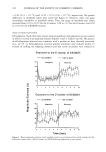
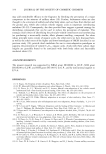
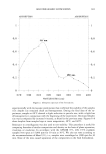
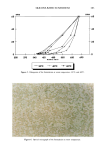
370 JOURNAL OF THE SOCIETY OF COSMETIC CHEMISTS + 0.50 (4.11 x 10⁻⁵%) and 11.95 + 0.55 (2.36 x 10⁻⁵%), respectively. No gender differences in threshold values were noted (see Figure 2). However, there was great intersubject variability in threshold values. Thus, the range of threshold step values extended from 6.25 to 16.25 for the E-isomer, 1.00 to 12.5 for the Z-isomer, and 6.50 to 16.50 for the EE3M2H mixture. TESTS OF CROSS-ADAPTATION Self-adaptation. Each ethyl ester isomer showed significant self-adaptation in each session in which it served as an adapting odorant (Figures 3 and 4, Tables I and II). The pattern of self-adaptation observed was consistent with a pattern we have observed previously (e.g., see ref. 3). Self-adaptation occurred quickly (estimates were reduced within 15 seconds of sniffing the adapting odorant) and was severe (estimates were reduced to Exposure to the E-Isomer of EE3M2H -a- (E)-EE3M2H -+- 10E:1Z3M2H 125 100, 125 IO0 0 0 Adaptation Recovery I I .... I,, T' T"-,'-.!-' I I .,,I,,,I,,.I,,,I,,.I,..I. I1{ I I.II 1,l. I I I 1 2 3 4 5 $ 7 8 9 10 Exposure to the Z-lsomer of EE3M2H -a- (Z)*EE3M2H -+- 10E:1Z3M2H Adaptation Recovery , ,J I,11 0 0 1 2 3 4 S 6 7 8 g 10 i I Time (min) Figure 3. Mean magnitude estimates (with standard errors) as a percentage of the initial estimates for the individual isomers and a 10E:lZ mixture of 3M2H following adaptation to each isomer.
Purchased for the exclusive use of nofirst nolast (unknown)
From: SCC Media Library & Resource Center (library.scconline.org)