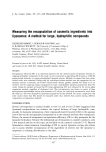
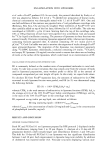
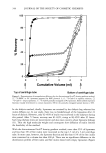
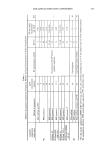
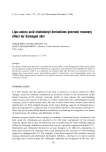
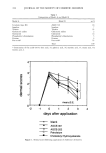
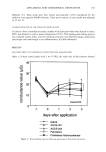
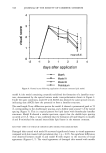
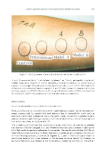
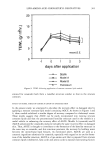
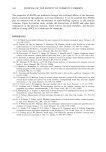
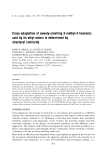
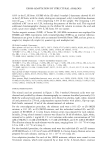
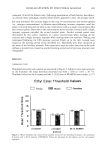
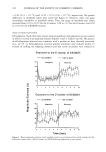
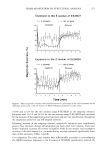
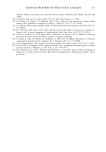
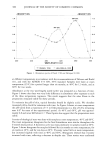
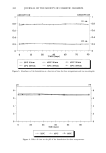
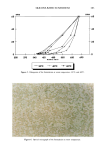
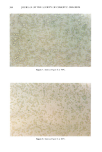
380 JOURNAL OF THE SOCIETY OF COSMETIC CHEMISTS ABSORPTION ABSORPTION 1,6 - 1.2 - 0.9 0.6 - 0.3 - 359 nm. 1.5 310 nm. 200 240 260 320 360 400 WAVELENGLT•I (nm) i • PARSOL 1789 • HELlOPAN E-1000 • Figure 1. Absorption spectra of Parsol 1789 and Heliopan E-1000. 1.2 -0.9 -0.6 • 0 0.3 at different temperatures in accordance with the recommendations of Delonca and Roehl (11), and with the AFNOR T73 409, 1976 standard. Samples were kept at room temperature (25øC) for a period longer than six months, at 40øC for 12 weeks, and at 60øC for two weeks. Absorbance at the two wavelengths noted earlier was measured as a function of time. Figure 3 shows that there was very little difference in absorbance after exposure to each of the three temperature regimens. This result suggests that the solar filters in the preparation remained stable for these periods. To maintain the pH of skin, topical formulas should be slightly acidic. We therefore measured pH to check for variations with time. As Figure 4 shows, at room temperature the pH varied from a maximum of 7.3 in fresh preparations to a low of 6.94, remaining near 6.97 for most of the experimental period. At 40øC and 60øC, pH was approxi- mately 6.8 and never fell below 6.7. These figures also suggest that the preparations were stable. A series of rheological tests was done with samples at room temperature, 40øC and 60øC. The room temperature rheograms for the final formulation were similar throughout the 6-month study period. A hysteresis cycle was most prominent in samples tested at 60øC. Figure 5 shows rheograms for samples followed for six months at room temperature, for six weeks at 40øC, and for ten days at 60øC. Viscosity varied little at room temperature, but increased slightly with time at 40øC and 60øC. Rheograms showed that viscosity increased with time, reflecting a decrease in droplet size. These results were confirmed

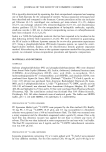
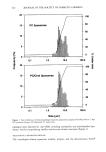
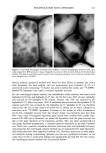
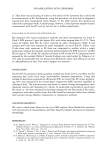
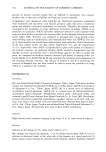
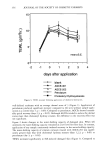
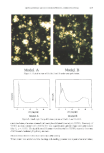
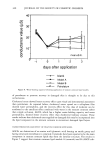
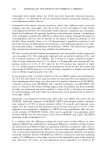
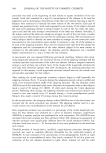
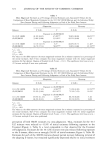
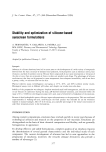
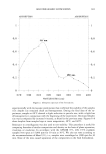
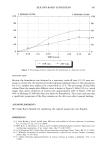
SILICONE-BASED SUNSCREENS 381 ABSORPTION ABSORPTION _ 0,6 - 0,4 - 311 rim. • 3•9 urn. -1 270 290 310 :320 340 359 370 400 WAVELENGTH (nm) Figure 2. Absorption spectrum of the formulation. -0,8 0,6 0,4 - 0,2 experimentally with microscopic examination that confirmed the stability of the samples (12): droplet size remained small and homogeneous. During the final days of the ex- periment, samples at 60øC showed a slight reduction in particle size, with a slight loss of homogeneity in comparison with the beginning of the experiment. Decreased droplet size was accompanied by increased viscosity, as found in the previous assay. Figures 6-8 show droplets from samples kept at room temperature, 40øC, and 60øC. Resistance to centrifugation was also used to test stability. This procedure is useful for comparing formulas of similar composition and density on the basis of phase separation, creaming, or exudation. In accordance with the AFNOR T73, 409, 1976 standard, samples were spun at 15,000 rpm for 10 min at 30øC. We also ran tests according to the recommendations of Merril (11), i.e., samples were centrifuged at 3000 rpm for 30 min. None of the tests caused separation of the components in the final formulation.
Purchased for the exclusive use of nofirst nolast (unknown)
From: SCC Media Library & Resource Center (library.scconline.org)