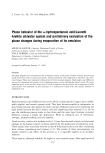
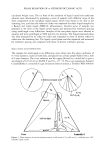
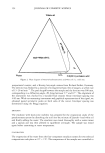
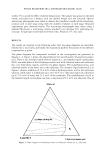
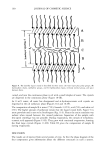
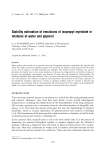
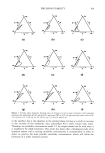
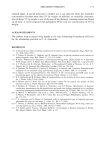
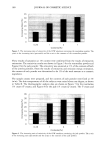
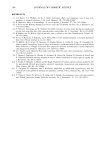
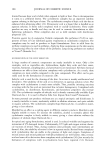
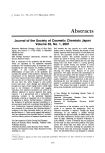
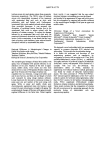
EMULSION STABILITY 169 o o o G G o S loo o S loo o S loo (a) (b) (c) o loo o loo /•oo looq•,._• • •l 0 loo 0 1•• i•pploo 0 S loo 0 S loo 0 S (d) (e) o o o lOO loo loo , o o s loo o s loo o s loo (g) (h) (i) Figure 1. Ternary phase diagrams showing areas of existence of oil-in-water emulsions with isopropyl myristate (O), polysorbate 80 (S), glycerol (G), and water (W) at 40øC for glycerol:water mass ratios of: (a) 1:9, (b) 2:8, (c) 3:7, (d) 4:6, (e) 5:5, (f) 6:4, (g) 7:3, (h) 8:2, and (i) 9:1. in the interface, but it also dissolves in the external phase, having as a result an increase in the viscosity of the emulsions, since polysorbate 80 is more viscous than water. Therefore, an emulsifier concentration under 1% by weight should not be used since it is insufficient for stable emulsions. This result also shows that a rheological study of an emulsion system with a varying emulsifier concentration is recommended in order to detect in practice the least possible emulsifier concentration, which will allow the formation of a stable emulsion system.

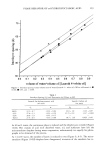
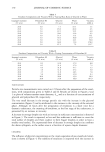
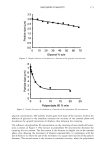
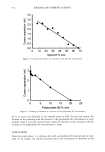
170 JOURNAL OF COSMETIC SCIENCE Table I Emulsion Compositions and Viscosity With a Varying Mass Ratio of Glycerol to Water Isopropyl myristate Polysorbate 80 Glycerol Water Viscosity (% w/w) (% w/w) (% w/w) (% w/w) (mPa s) 20.0 5.0 7.5 67.5 3.5 20.0 5.0 15.0 60.0 4.5 20.0 5.0 22.5 52.5 6.9 20.0 5.0 30.0 45.0 9.3 20.0 5.0 37.5 37.5 15.1 20.0 5.0 45.0 30.0 27.9 20.0 5.0 52.5 22.5 59.0 20.0 5.0 60.0 15.0 178.9 20.0 5.0 67.5 7.5 351.7 Table II Emulsion Compositions and Viscosity With a Varying Concentration of Polysorbate 80 Isopropyl myristate Polysorbate 80 Glycerol Water Viscosity (% w/w) (% w/w) (% w/w) (% w/w) (mPa s) 20.0 0.1 32.0 47.9 8.8 20.0 0.2 31.9 47.9 7.2 20.0 0.5 31.8 47.7 5.3 20.0 1.0 31.6 47.4 5.0 20.0 2.5 31.0 46.5 7.8 20.0 5.0 30.0 45.0 9.3 20.0 10.0 28.0 42.0 16.9 20.0 20.0 24.0 36.0 107.9 PARTICLE SIZE Particle size measurements were carried out 24 hours after the preparation of the emul- sions, with compositions given in Tables I and II. Results are shown in Figures 2 and 3 as plots of volume-number mean diameter, dv• , and as a function of concentrations of glycerol and polysorbate 80, respectively. The very small decrease in the average particle size with the increase in the glycerol concentration (Figure 2) can be attributed to the increase in the viscosity of the external phase. Although 24 hours after the preparation of emulsions is a short time for a dramatic coalescence, the creaming of emulsions, as the first stage of the coalescence, is prevented by an increase in viscosity. A decrease in average droplet size with an increase in surfactant concentration is observed in Figure 3. The result is expected, as less and less surfactant is sufficient to cover the total surface of droplets and these coalesce to form bigger droplets in order to have a smaller total surface. The exponential form of decrease in average droplet size confirms the above syllogism, as the surface area is a function of square droplet diameter. CREAMING The influence of glycerol concentration on the cream separation of one-month-old emul- sions is shown in Figure 4. The stability of emulsions is improved with the increase in
Purchased for the exclusive use of nofirst nolast (unknown)
From: SCC Media Library & Resource Center (library.scconline.org)